Power BI & Tableau Dashboard Examples
Interactive dashboard portfolio for business reporting
Explore Power BI and Tableau dashboard examples for sales, finance, marketing, healthcare, and executive reporting. Each report shows how business data can become clearer, faster, and easier to act on.
16+
Dashboard Examples
4
Business Categories
2
Editor’s Picks
150k+
Portfolio Views
Editor's Pick
Latest selected dashboards from the portfolio.
Healthcare
Clinical Operations Dashboard
A Tableau clinical operations dashboard built to help healthcare teams monitor workload, service usage, patient activity, and performance indicators.
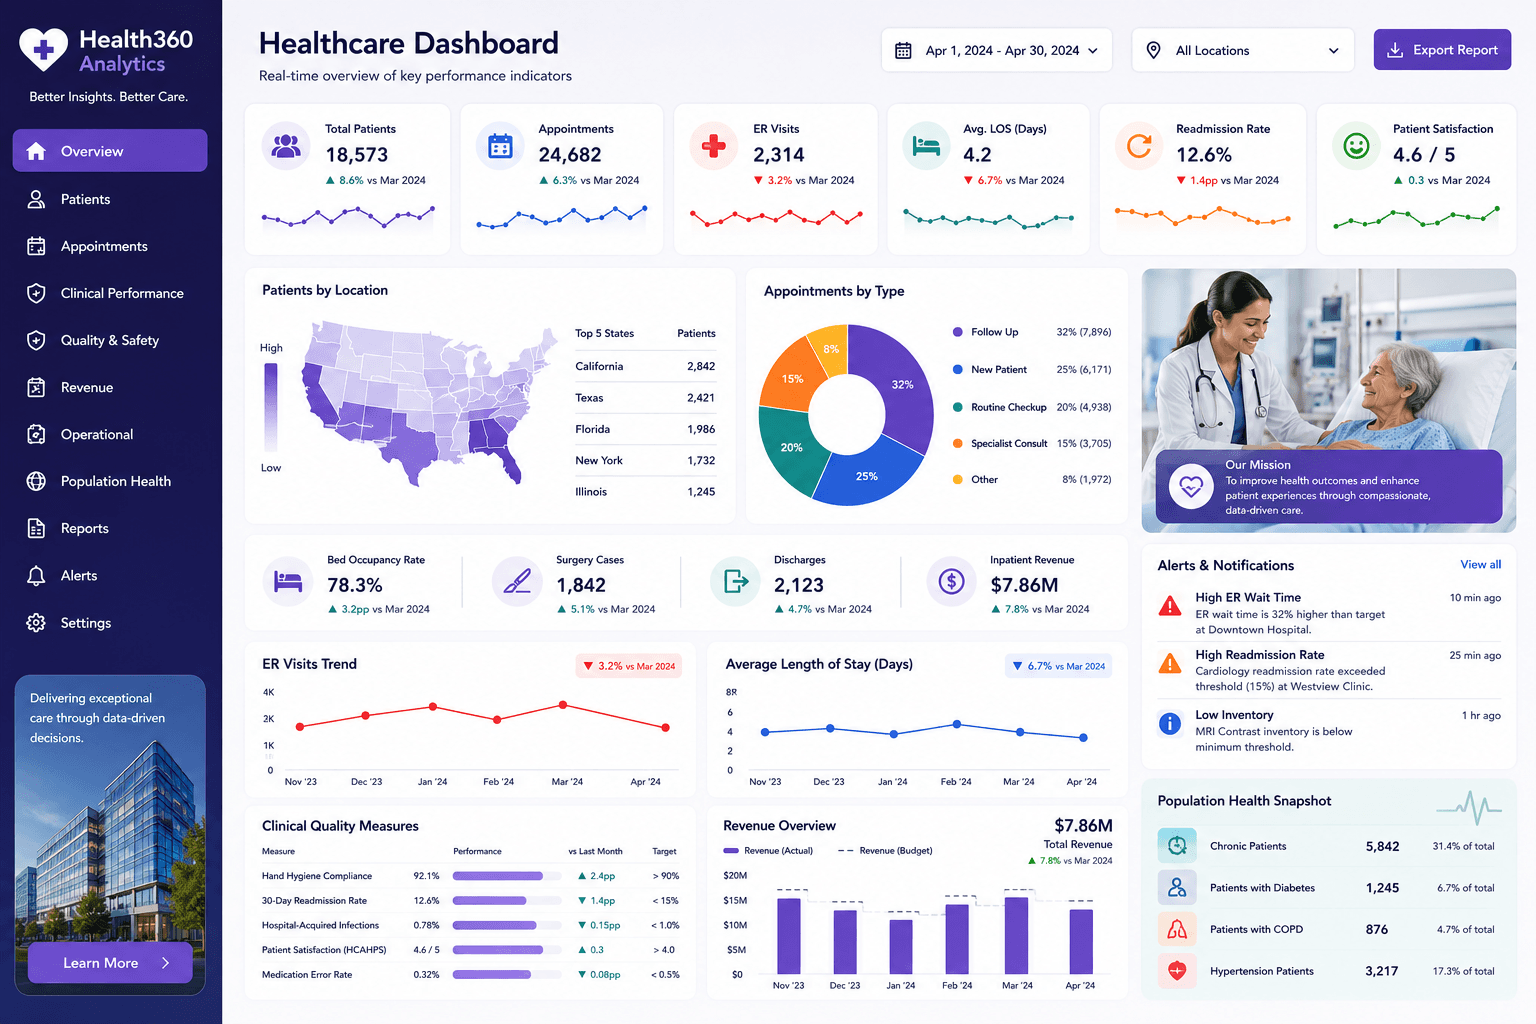
Healthcare
Tableau Healthcare Dashboard
A Tableau healthcare dashboard designed to help teams explore patient activity, service demand, and operational performance.
All Reports
16 results
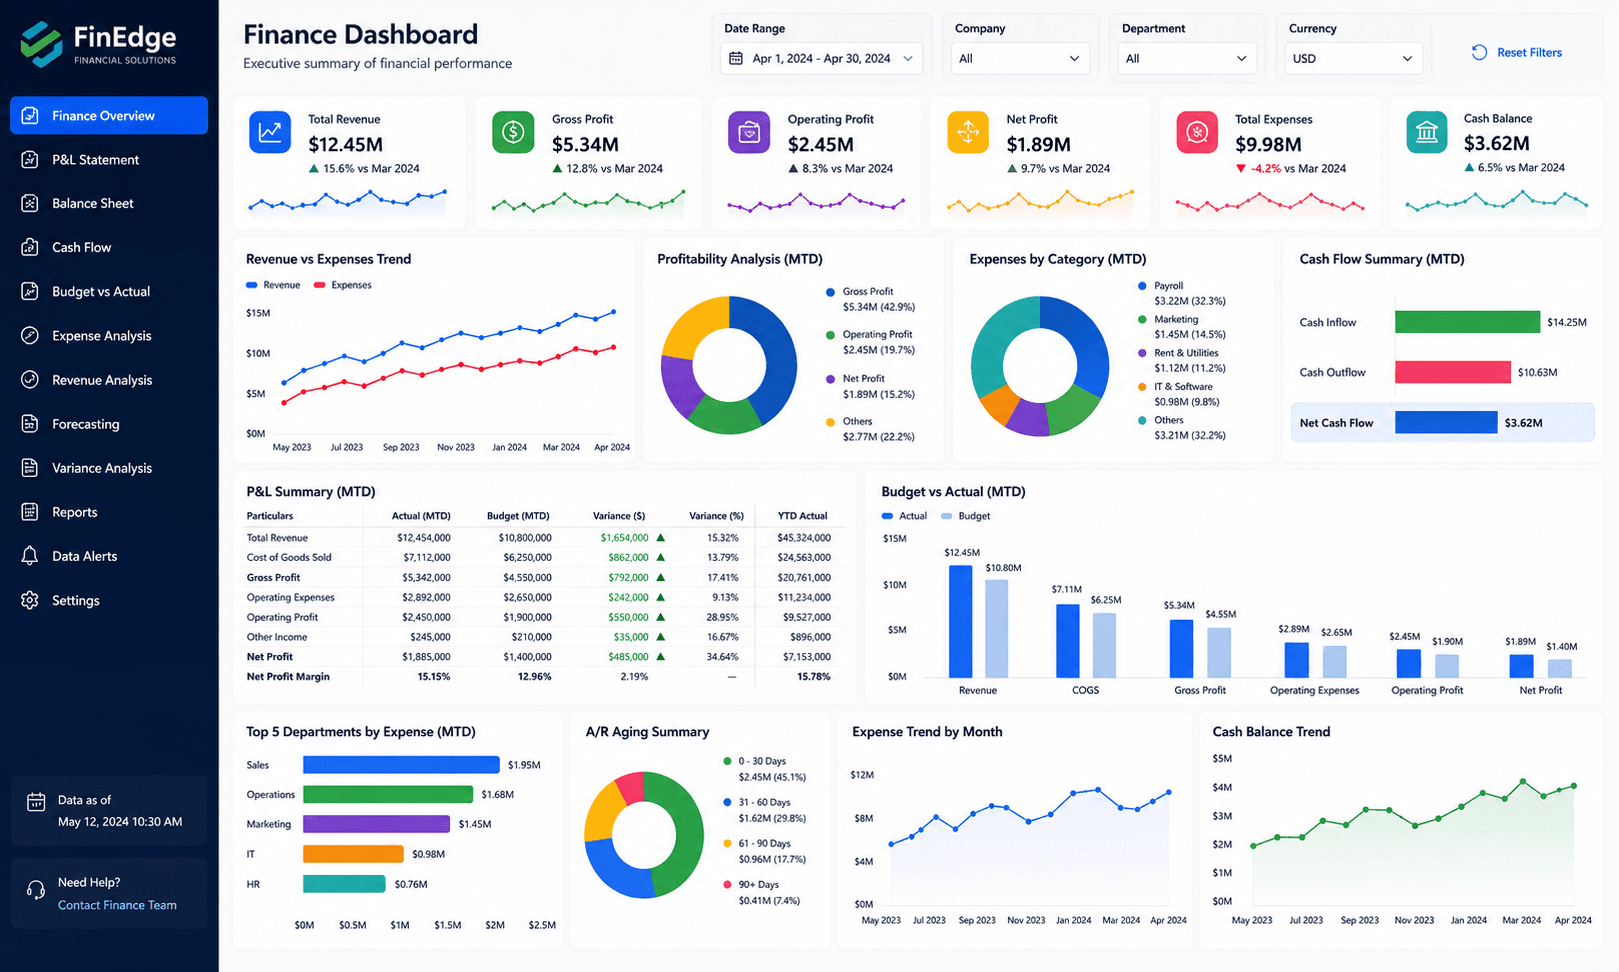
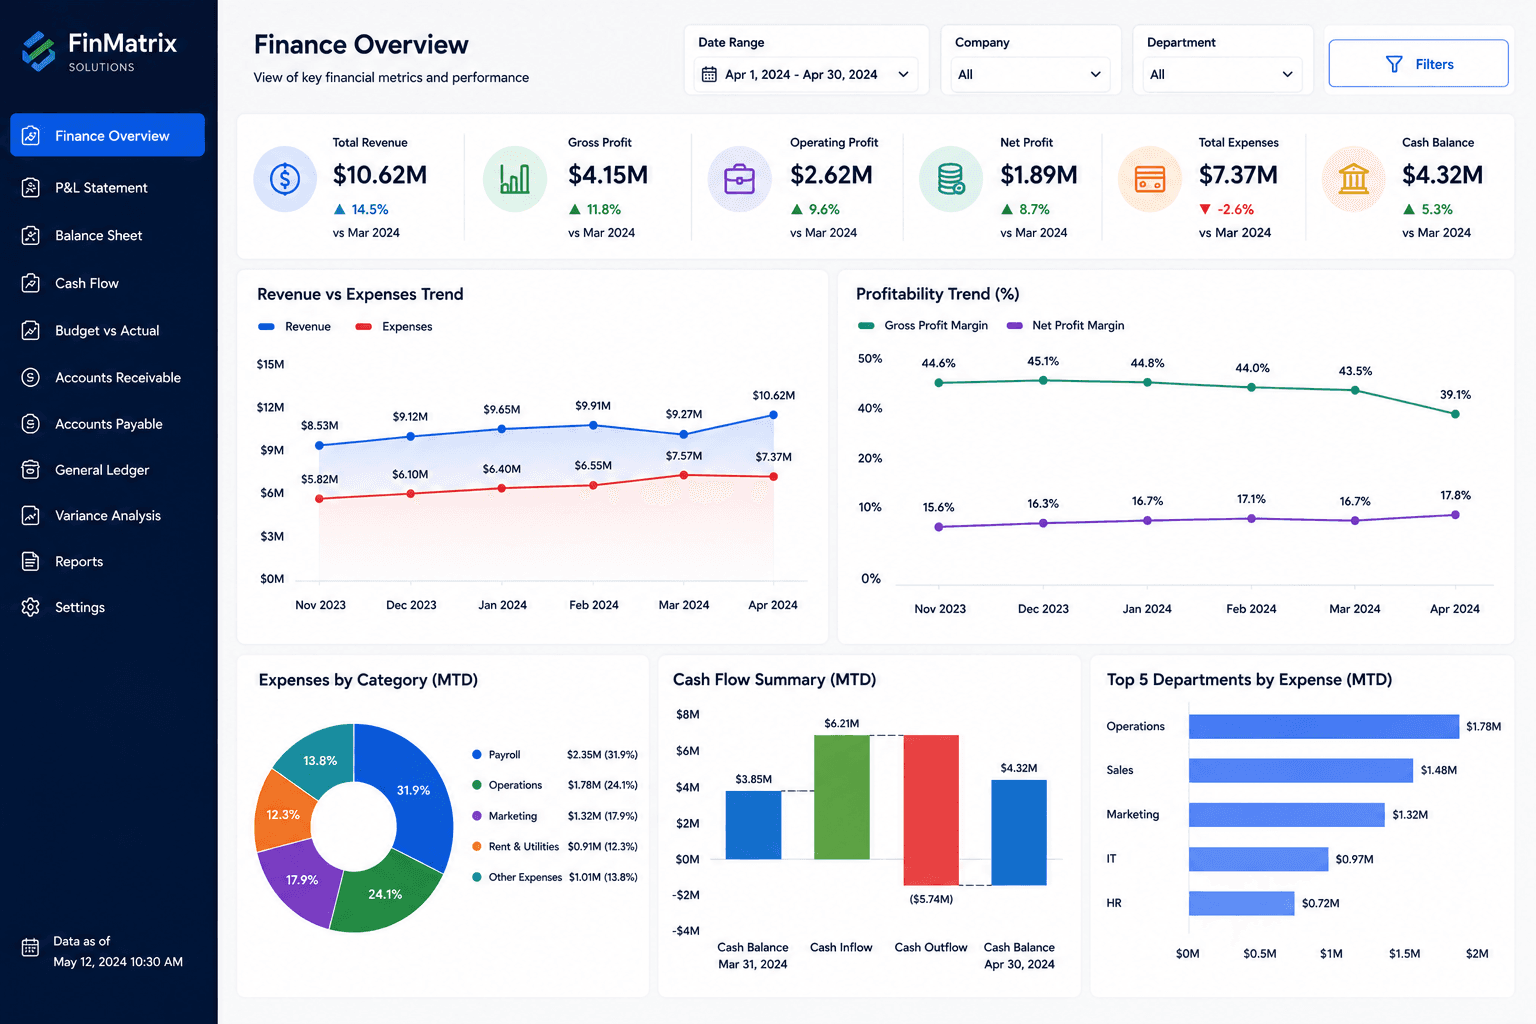
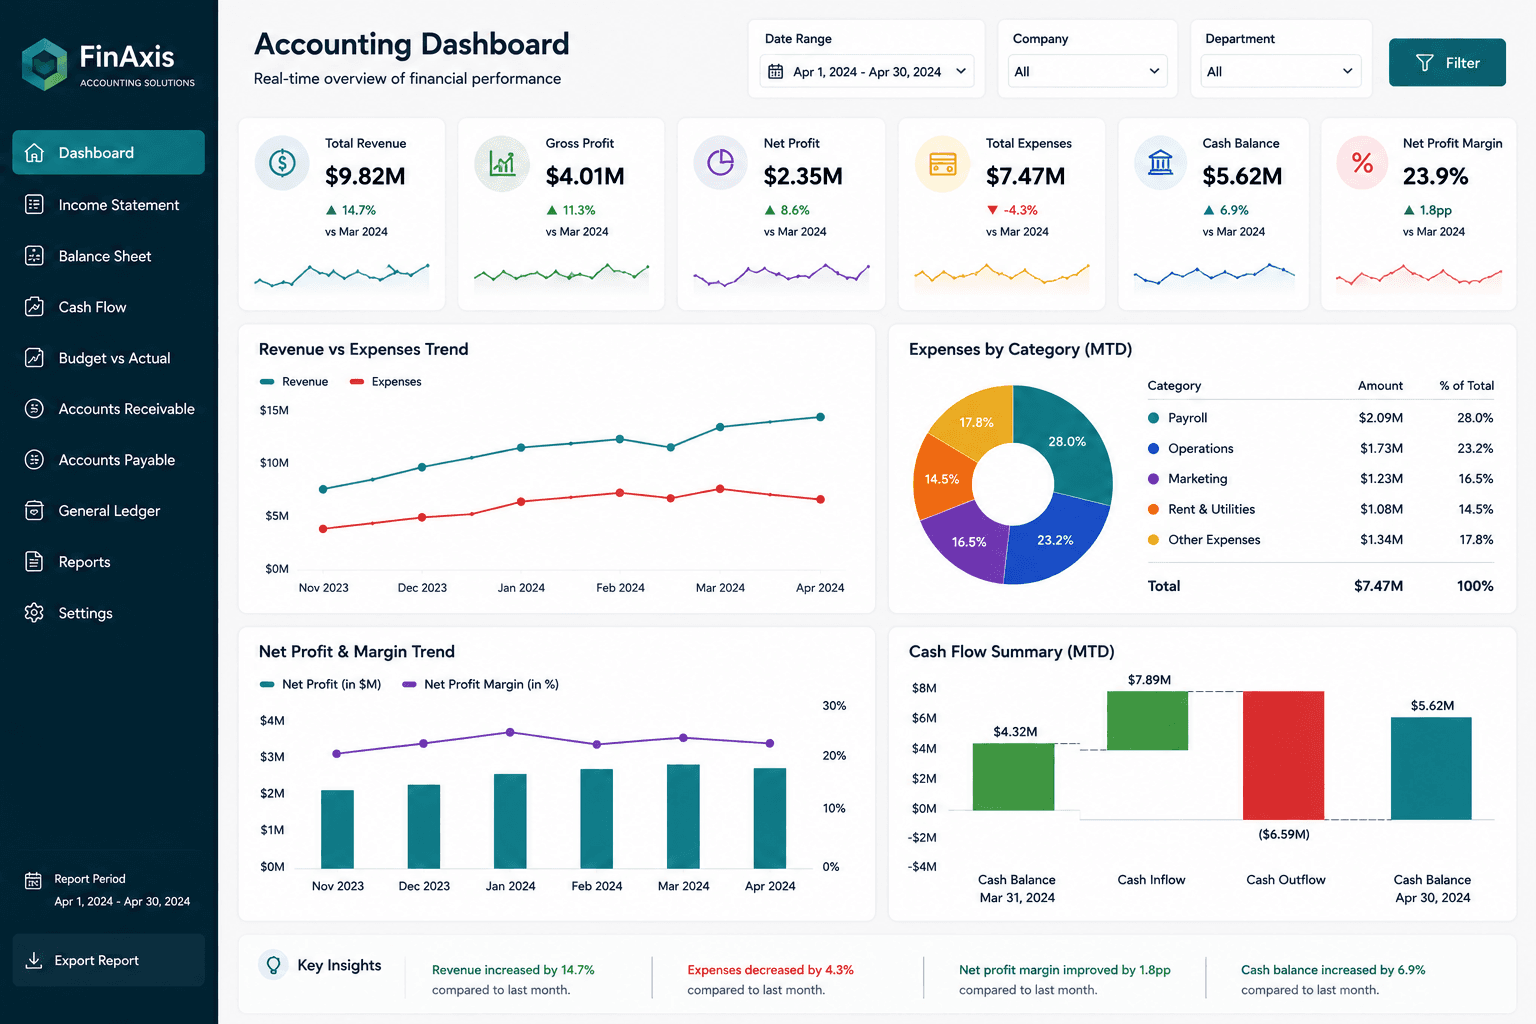
Accounting & Finance
Finance Reporting Dashboard
A Power BI finance dashboard built for financial reporting, profitability monitoring, expense control, and management decision-making.

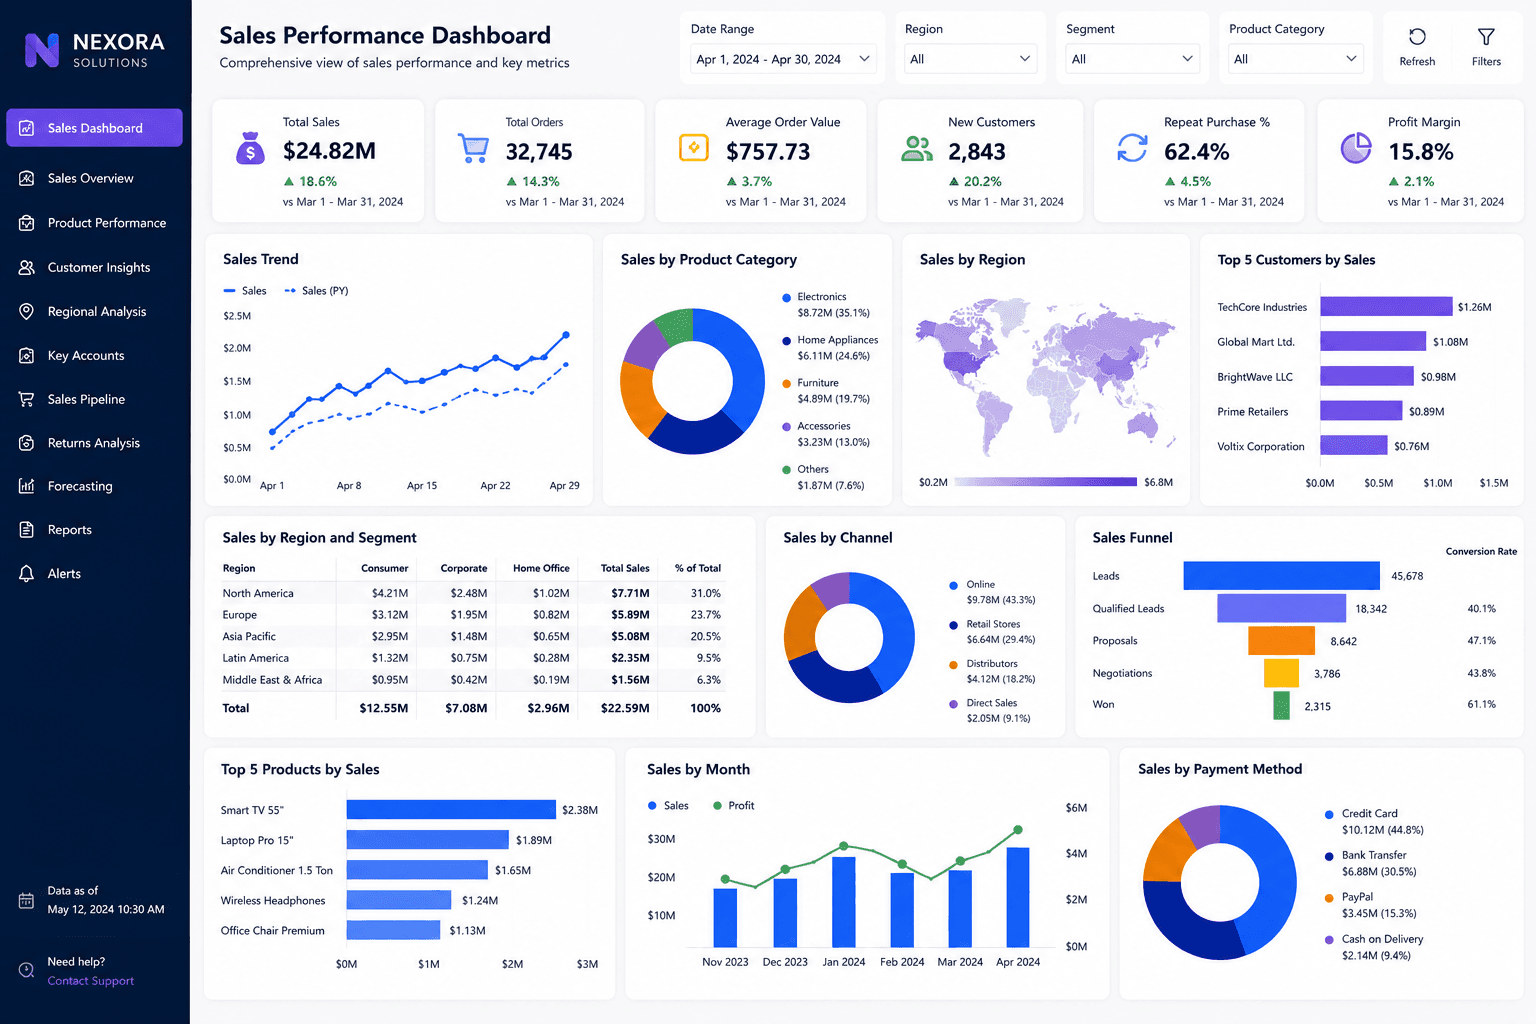
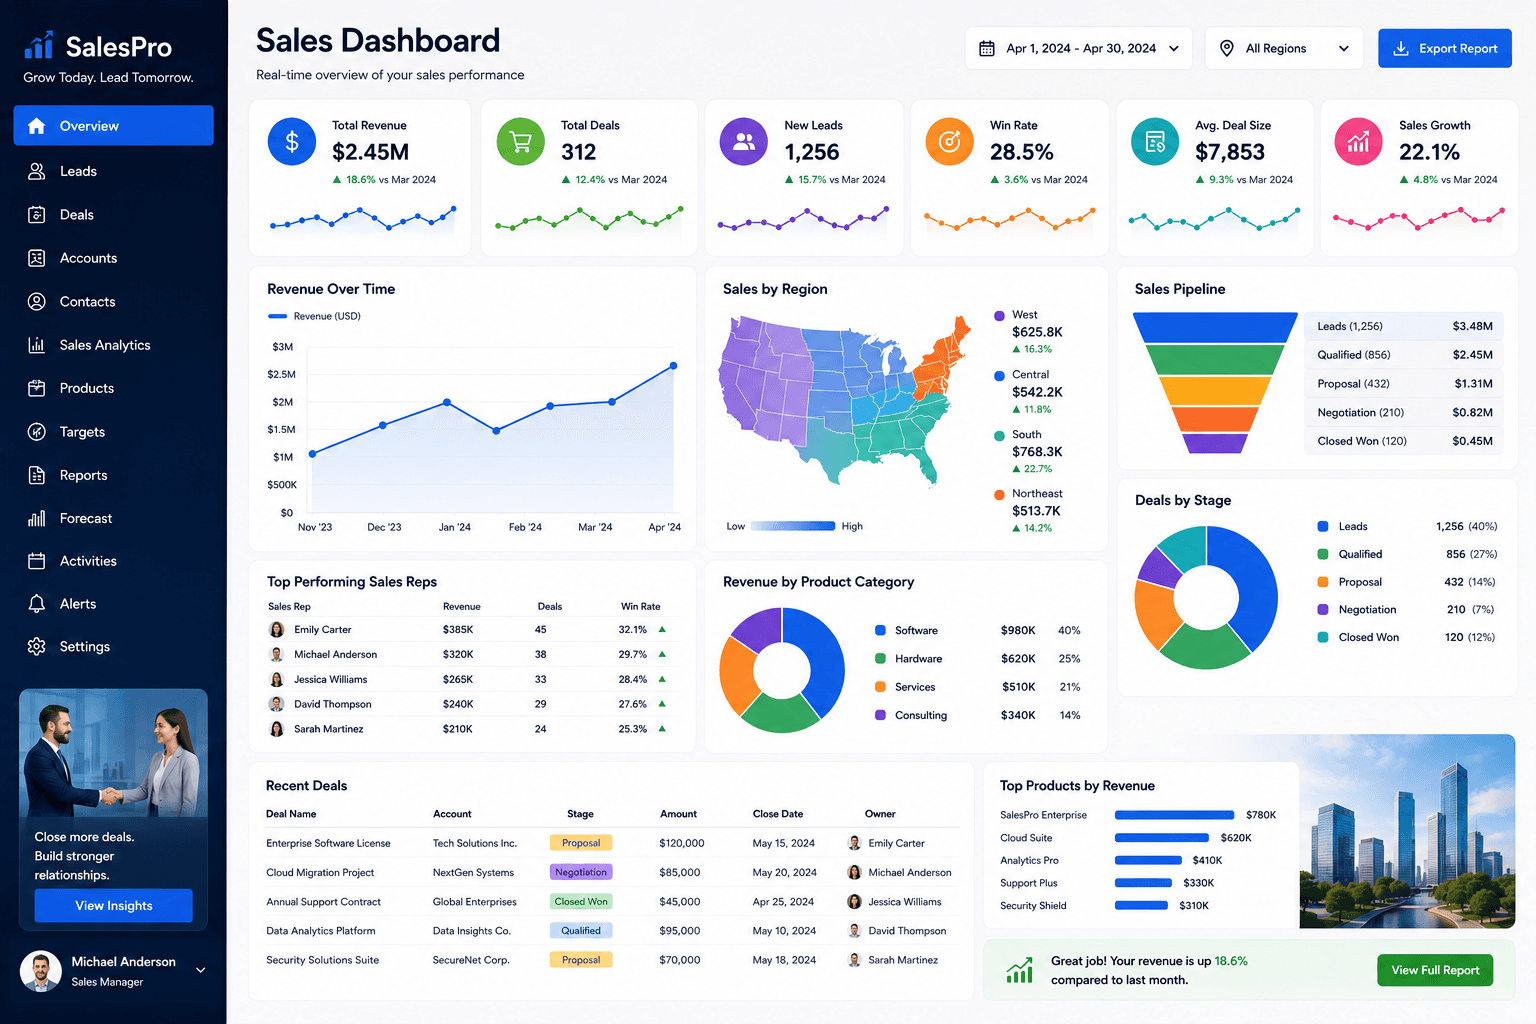
Sales
Sales Performance Dashboard
A modern Power BI sales dashboard developed for revenue tracking, regional performance, customer segmentation, and executive KPI monitoring.
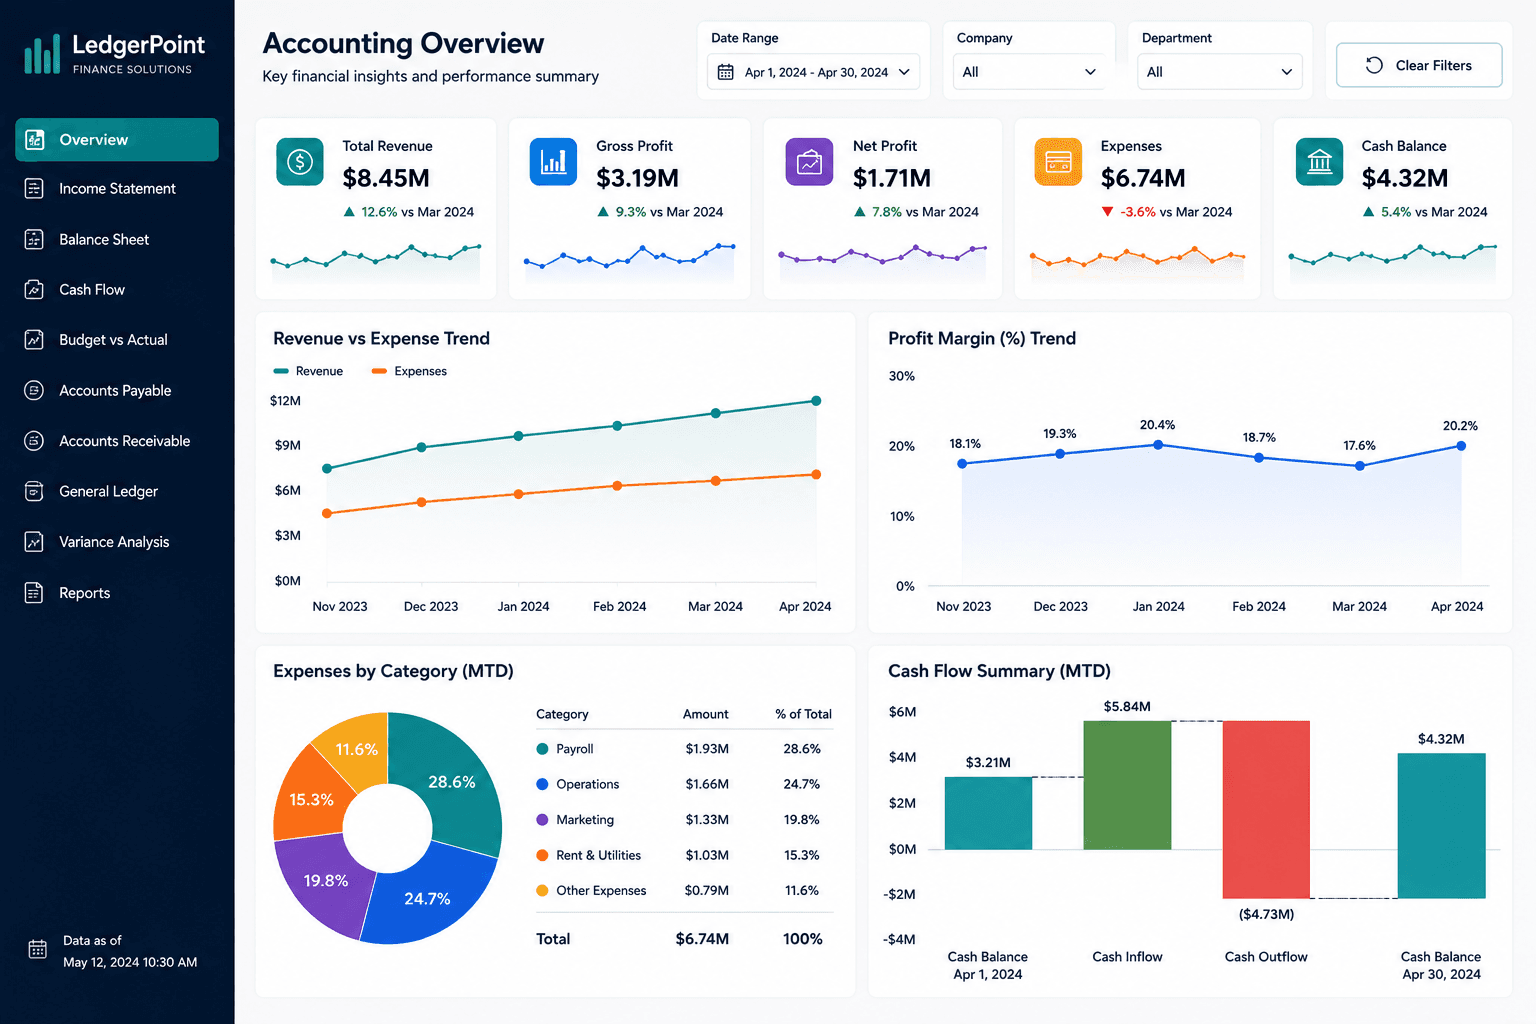
Accounting & Finance
Profit & Loss Dashboard
A Power BI profit and loss dashboard designed to help businesses monitor income, expenses, gross profit, net profit, and budget performance.
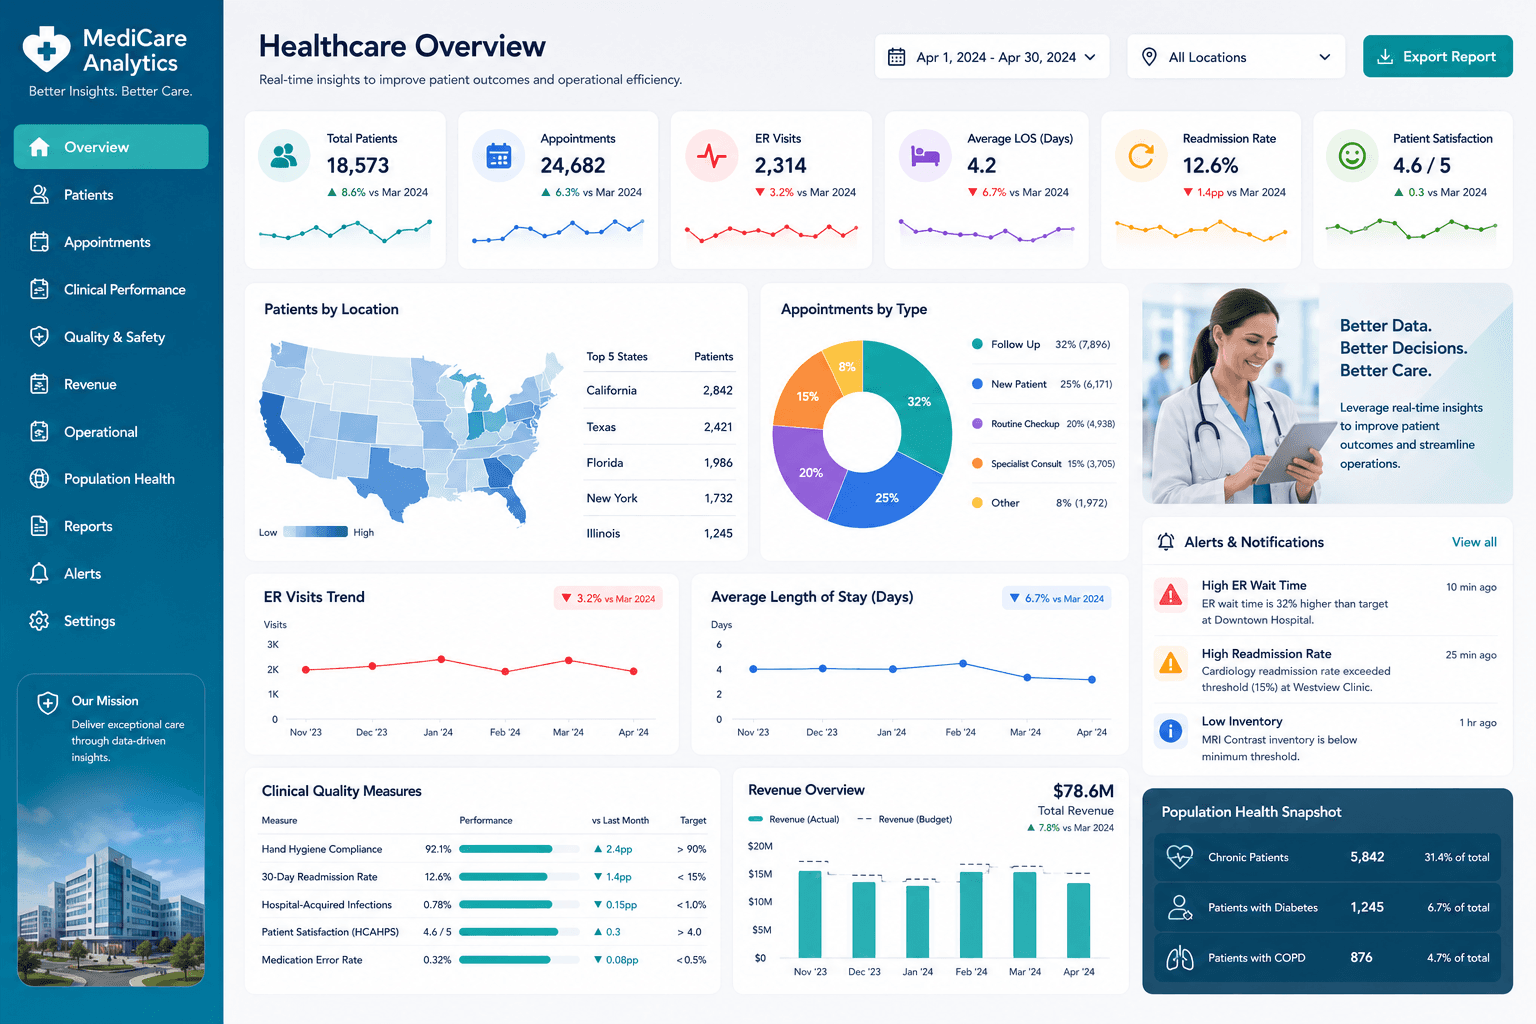
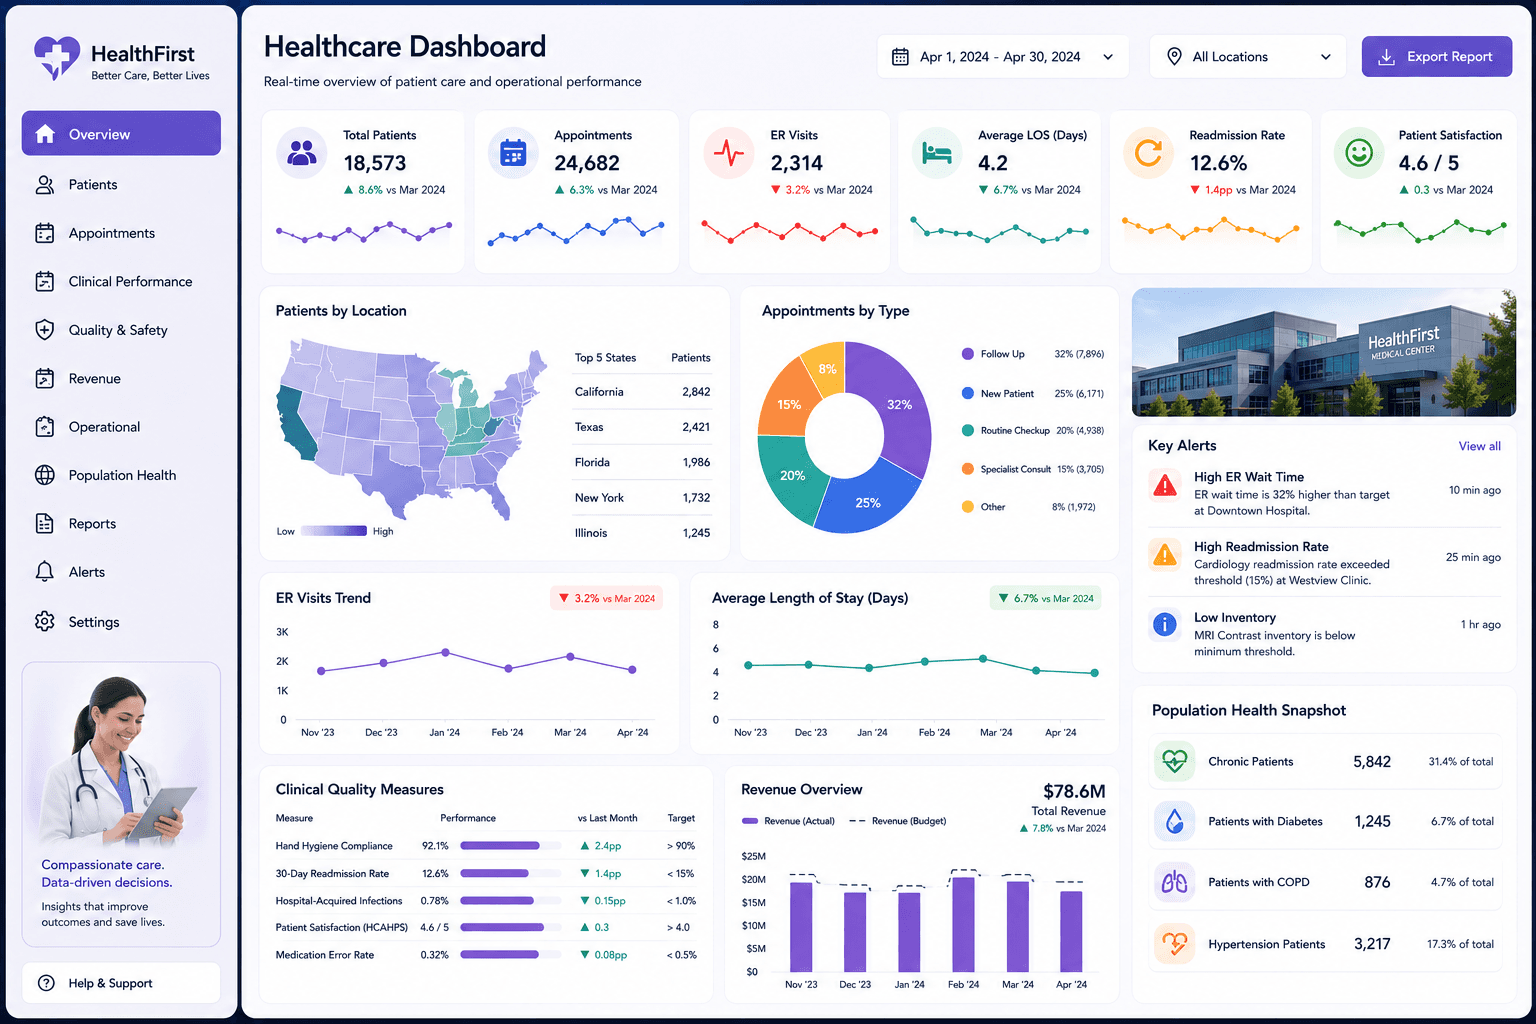
Healthcare
Healthcare Performance Dashboard
A Power BI healthcare dashboard designed to monitor patient trends, service utilization, operational performance, and healthcare KPIs.
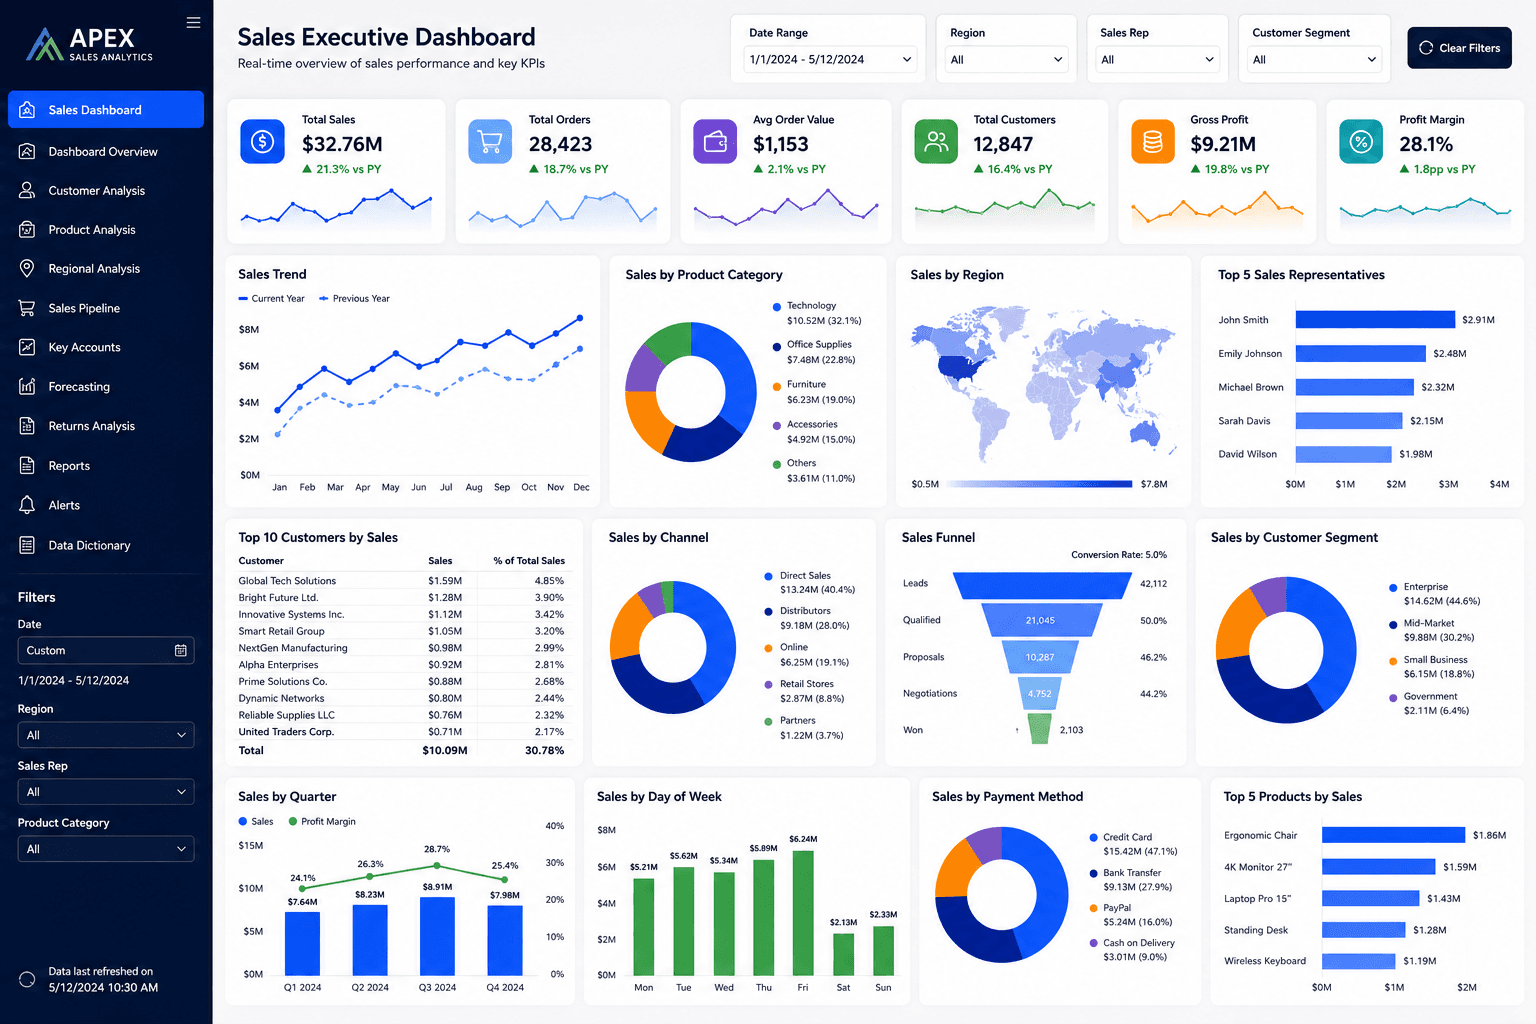
Sales
Executive Sales KPI Dashboard
An executive Power BI dashboard for monitoring revenue growth, target achievement, sales performance, and management KPIs.
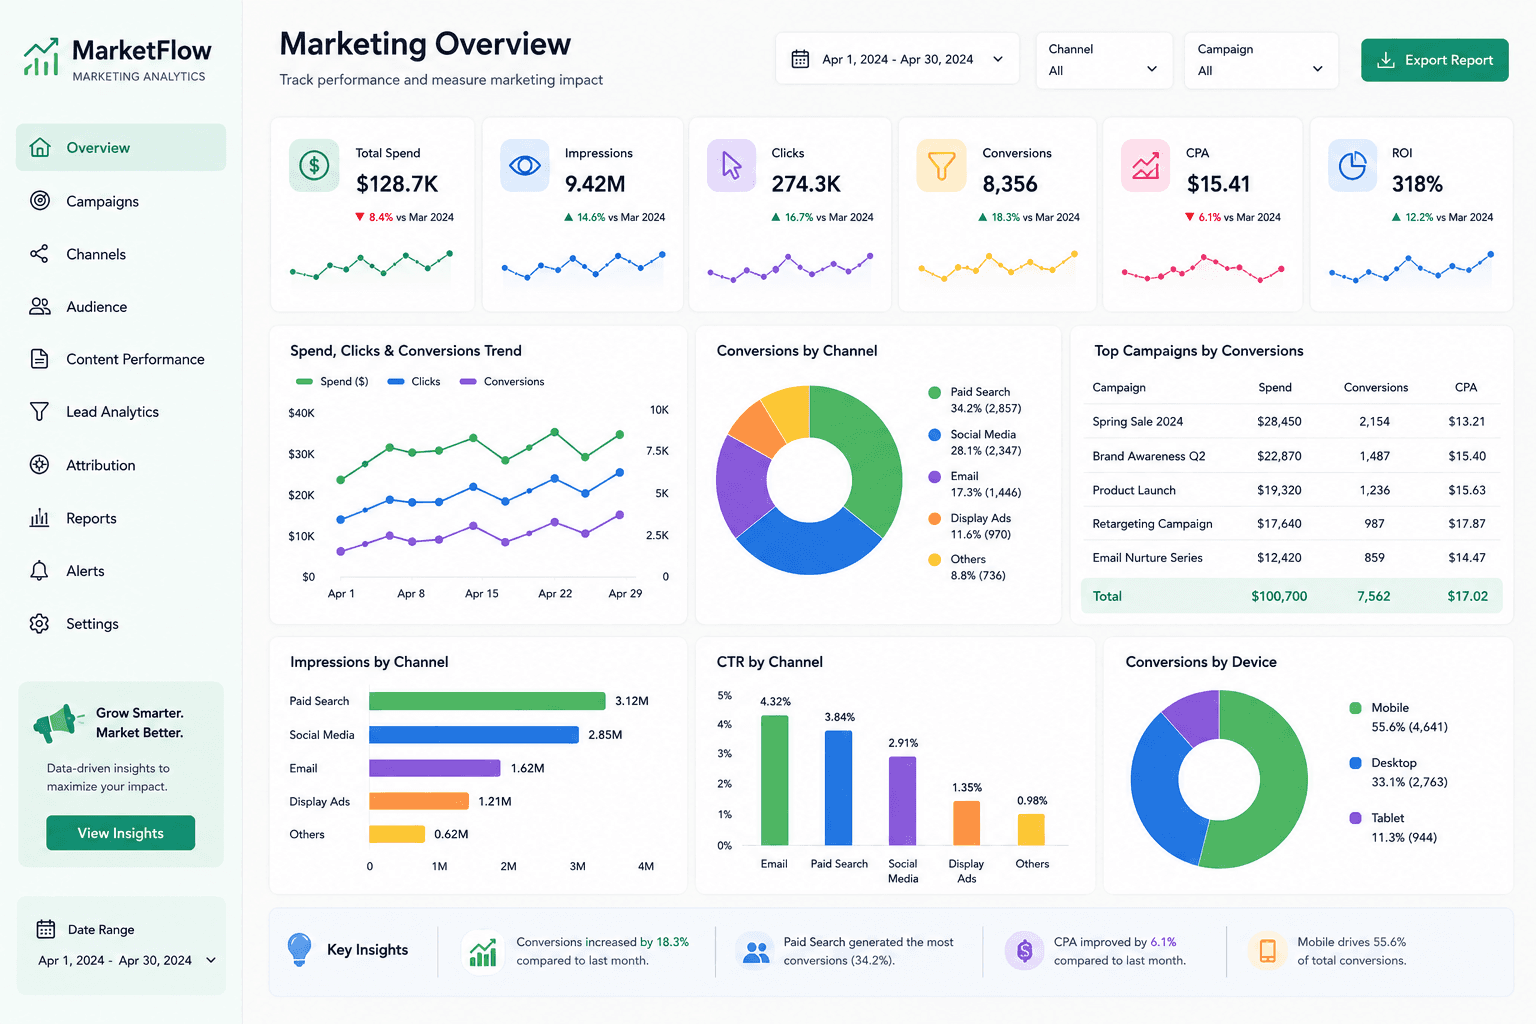
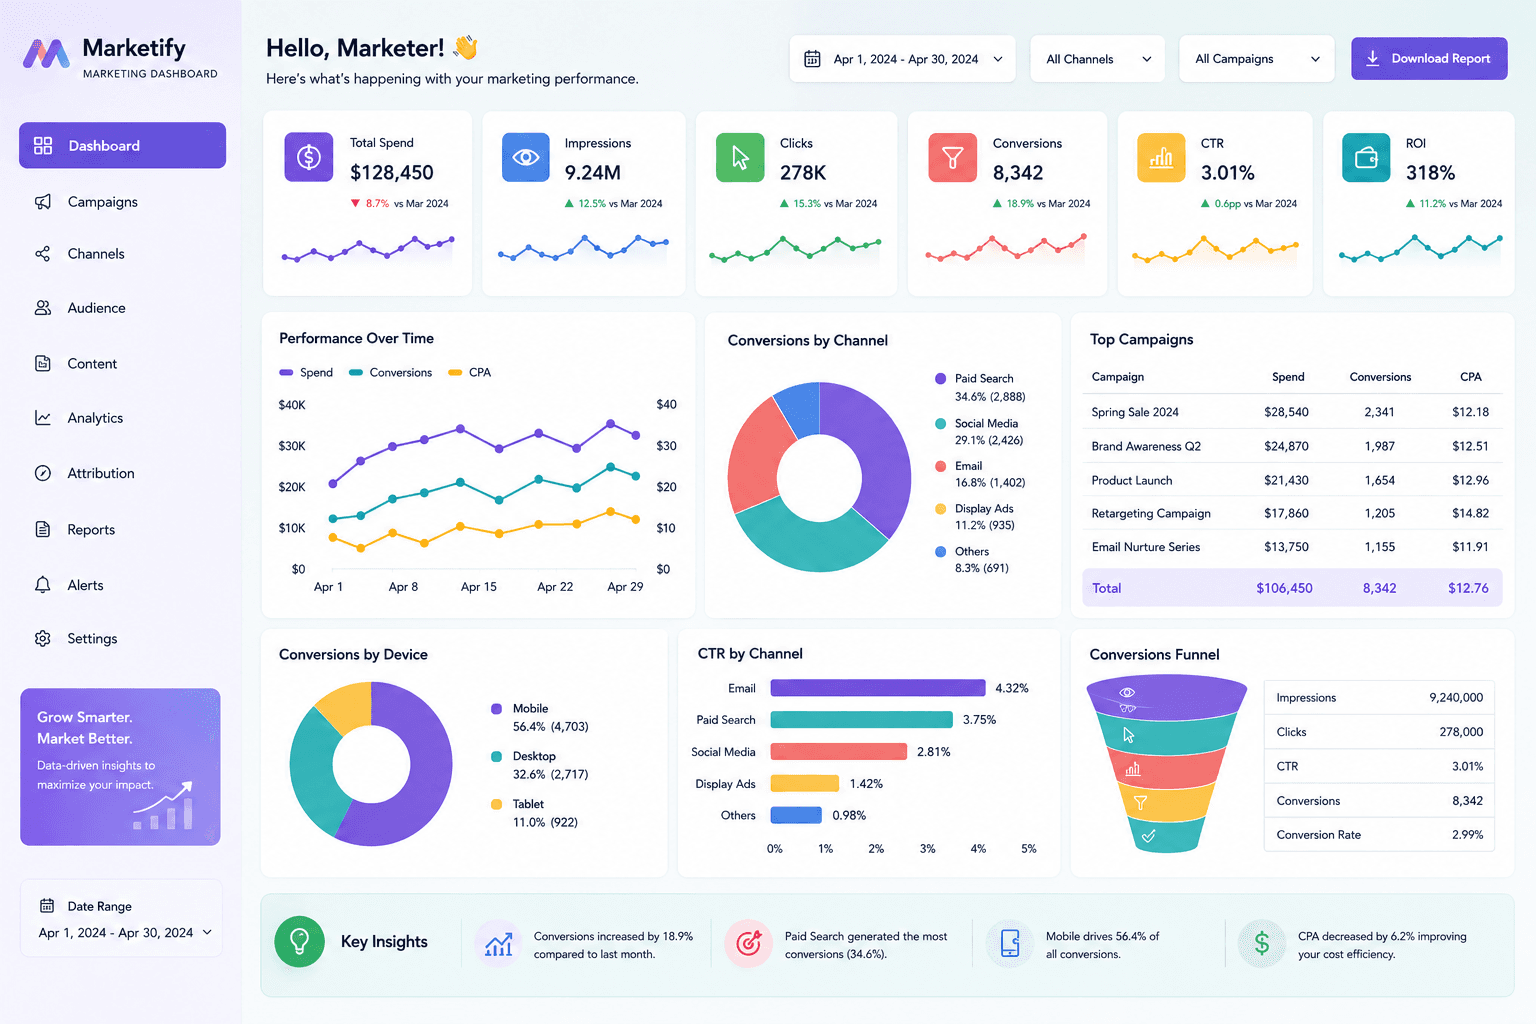
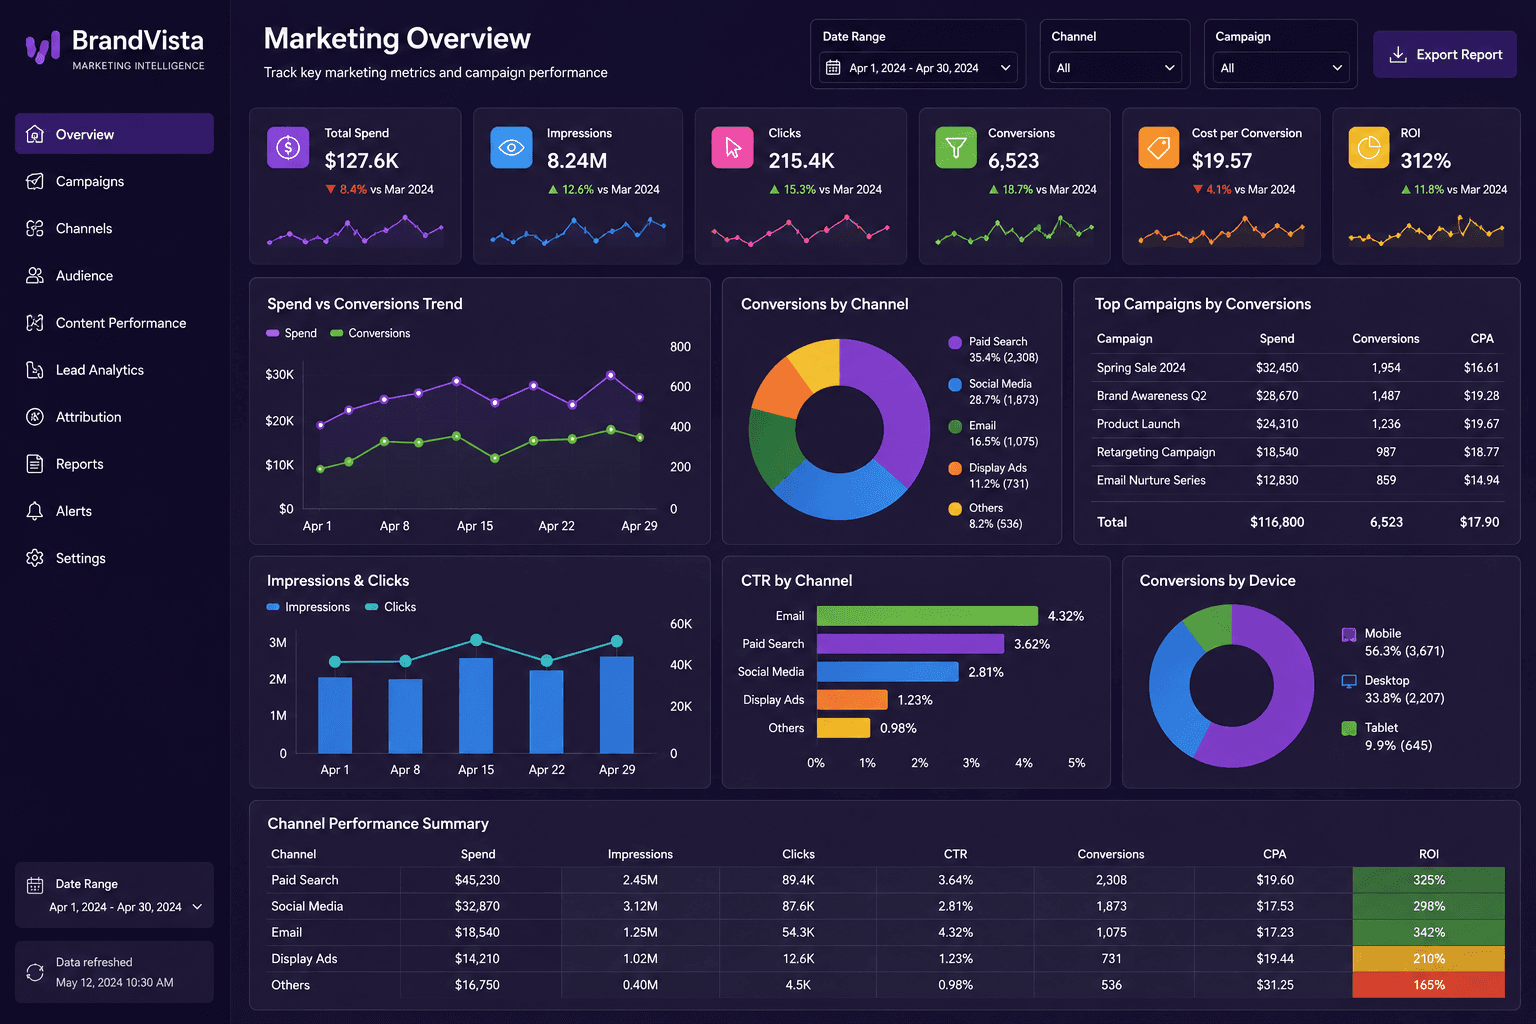
Marketing
Marketing Performance Dashboard
A Power BI marketing dashboard created to track campaign performance, leads, conversion rates, channel ROI, and marketing growth.
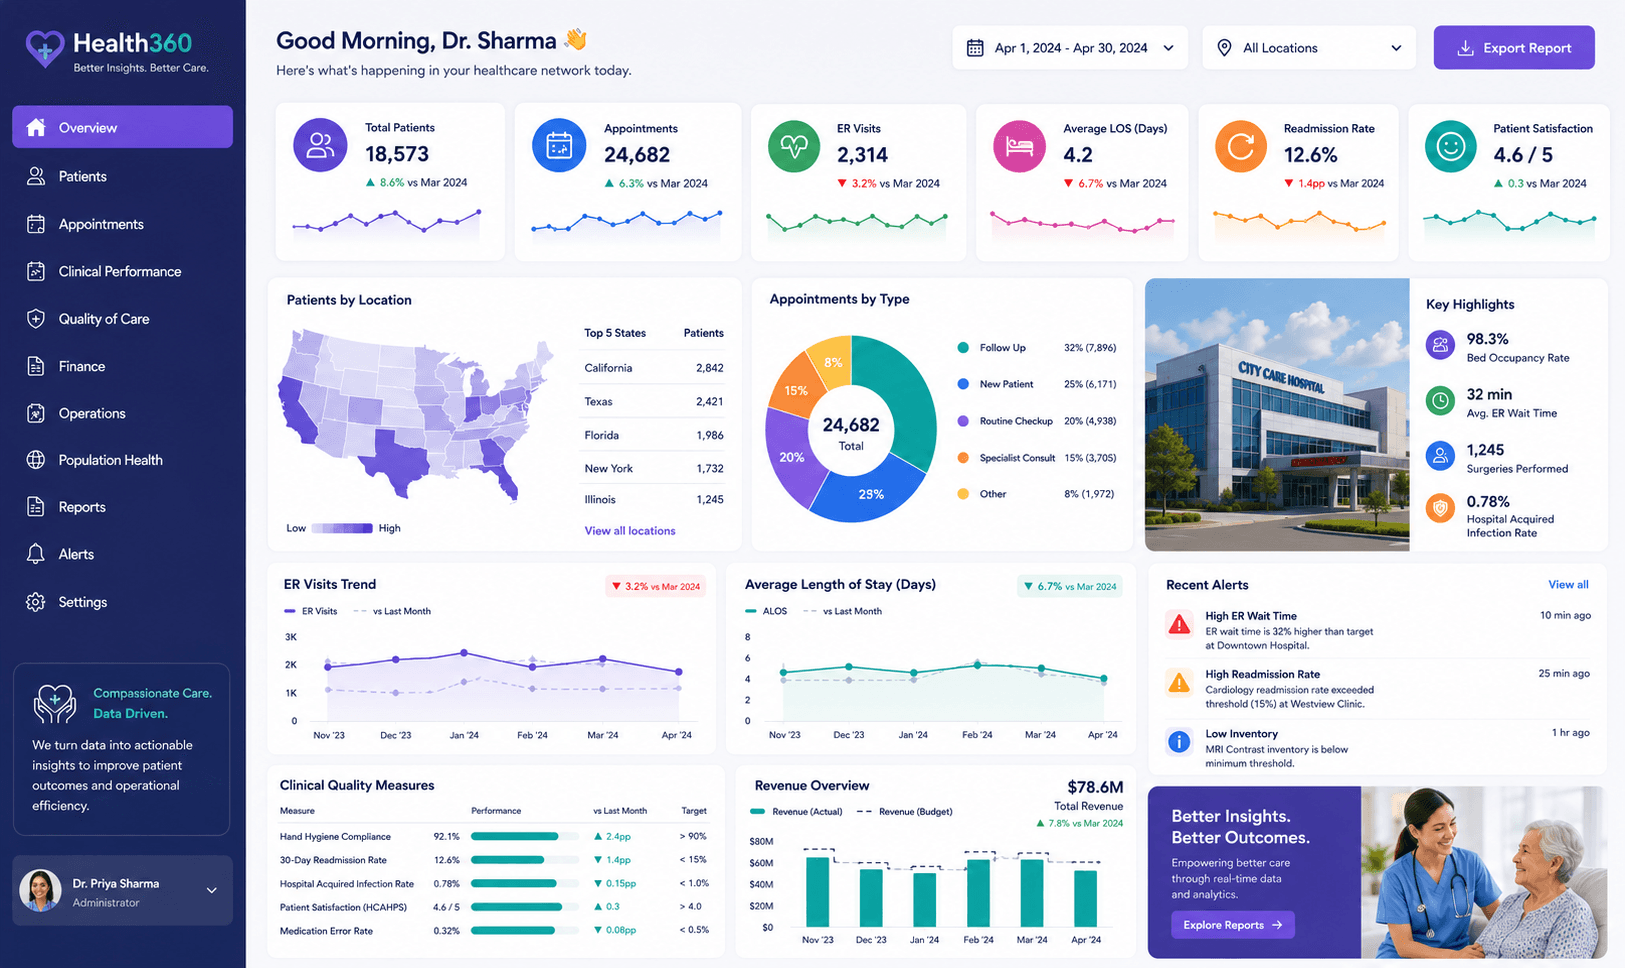
Healthcare
Patient Analytics Dashboard
A Power BI patient analytics dashboard created to help healthcare teams understand patient trends, visit patterns, and service demand.
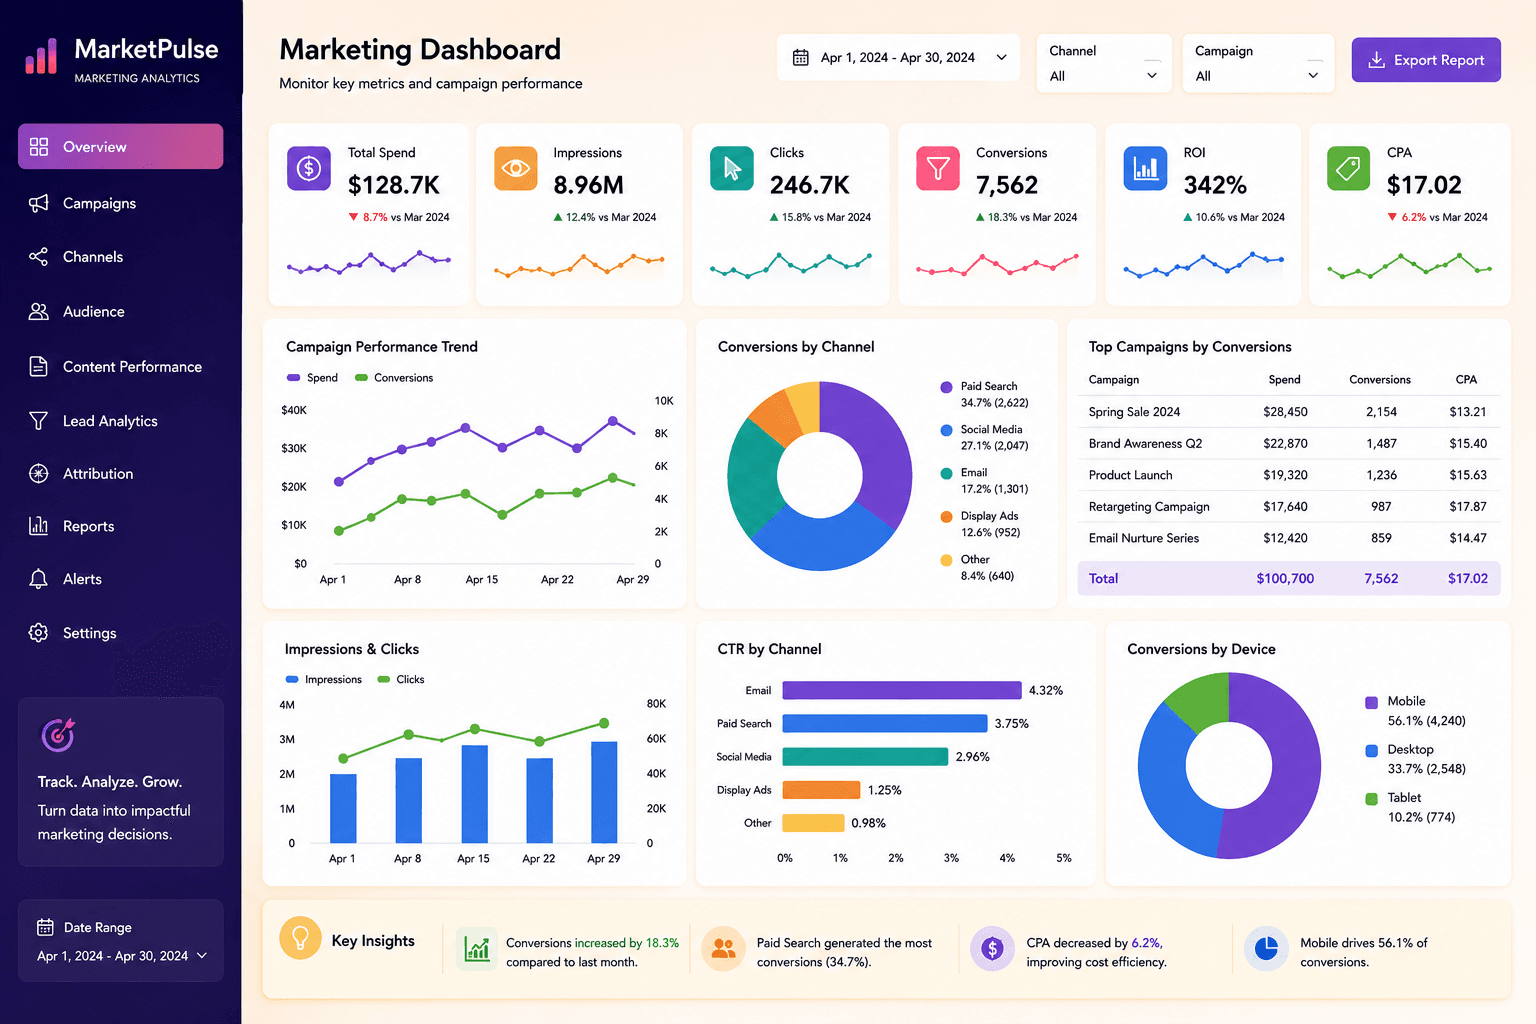
Marketing
Digital Marketing ROI Dashboard
A Power BI digital marketing ROI dashboard built to help teams track ad spend, leads, conversions, campaign revenue, and return on investment.
Accounting & Finance
Tableau Finance Dashboard
A Tableau finance dashboard designed for visual financial analysis, cost tracking, profitability review, and executive reporting.
Sales
Tableau Sales Performance Dashboard
A Tableau sales dashboard designed to help teams explore sales trends, customer segments, and product contribution visually.
Marketing
Tableau Marketing Campaign Dashboard
A Tableau marketing campaign dashboard designed to help teams explore campaign performance, lead generation, conversion rates, and channel results.
Healthcare
Tableau Healthcare Dashboard
A Tableau healthcare dashboard designed to help teams explore patient activity, service demand, and operational performance.
Sales
Tableau Sales Management Dashboard
A Tableau sales management dashboard created to help managers track targets, customer trends, and product performance.
Accounting & Finance
Tableau Expense Analysis Dashboard
A Tableau expense analysis dashboard built to help businesses understand spending patterns, budget variance, and cost control opportunities.
Marketing
Tableau Marketing Funnel Dashboard
A Tableau marketing funnel dashboard that helps teams understand how leads move from awareness to conversion.
Healthcare
Clinical Operations Dashboard
A Tableau clinical operations dashboard built to help healthcare teams monitor workload, service usage, patient activity, and performance indicators.