Summary
This dashboard gives marketing teams a clear view of campaigns, channels, leads, conversions, and ROI.
Project objectives
- Show which campaigns generate results.
- Improve lead and conversion tracking.
- Support smarter marketing budget decisions.
Business challenge
The client had campaign data from different platforms but lacked one clear reporting view.
How the dashboard was built
We cleaned campaign data, standardized channel names, created DAX measures for conversion rates, cost per lead, ROI, and campaign performance.
Solution delivered
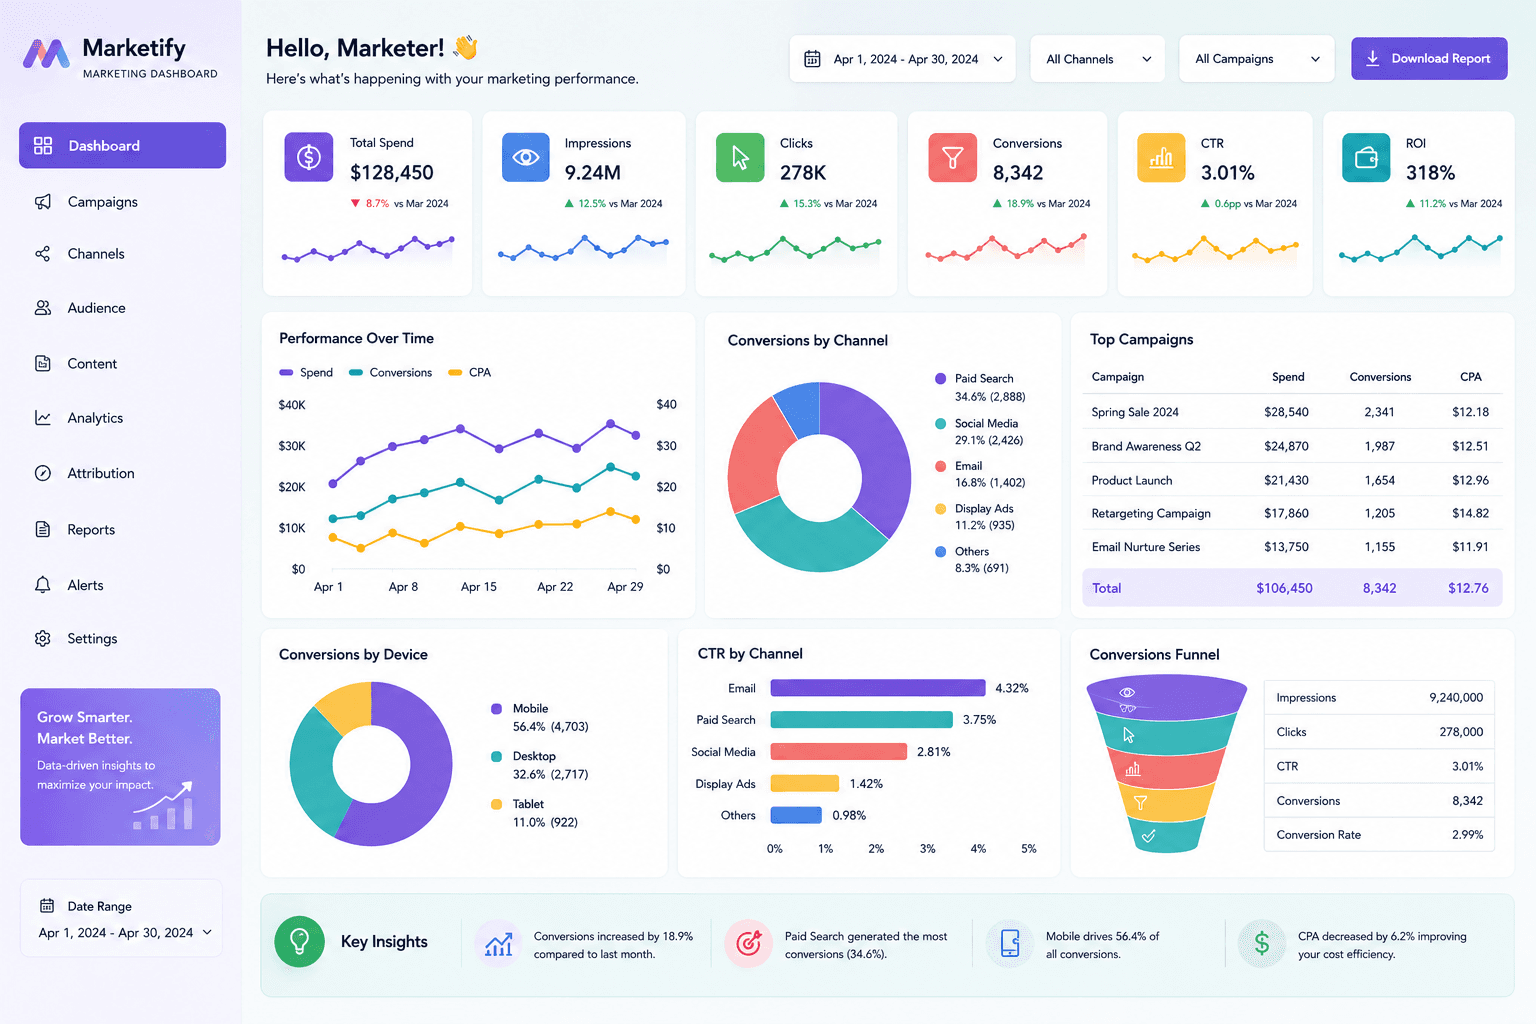
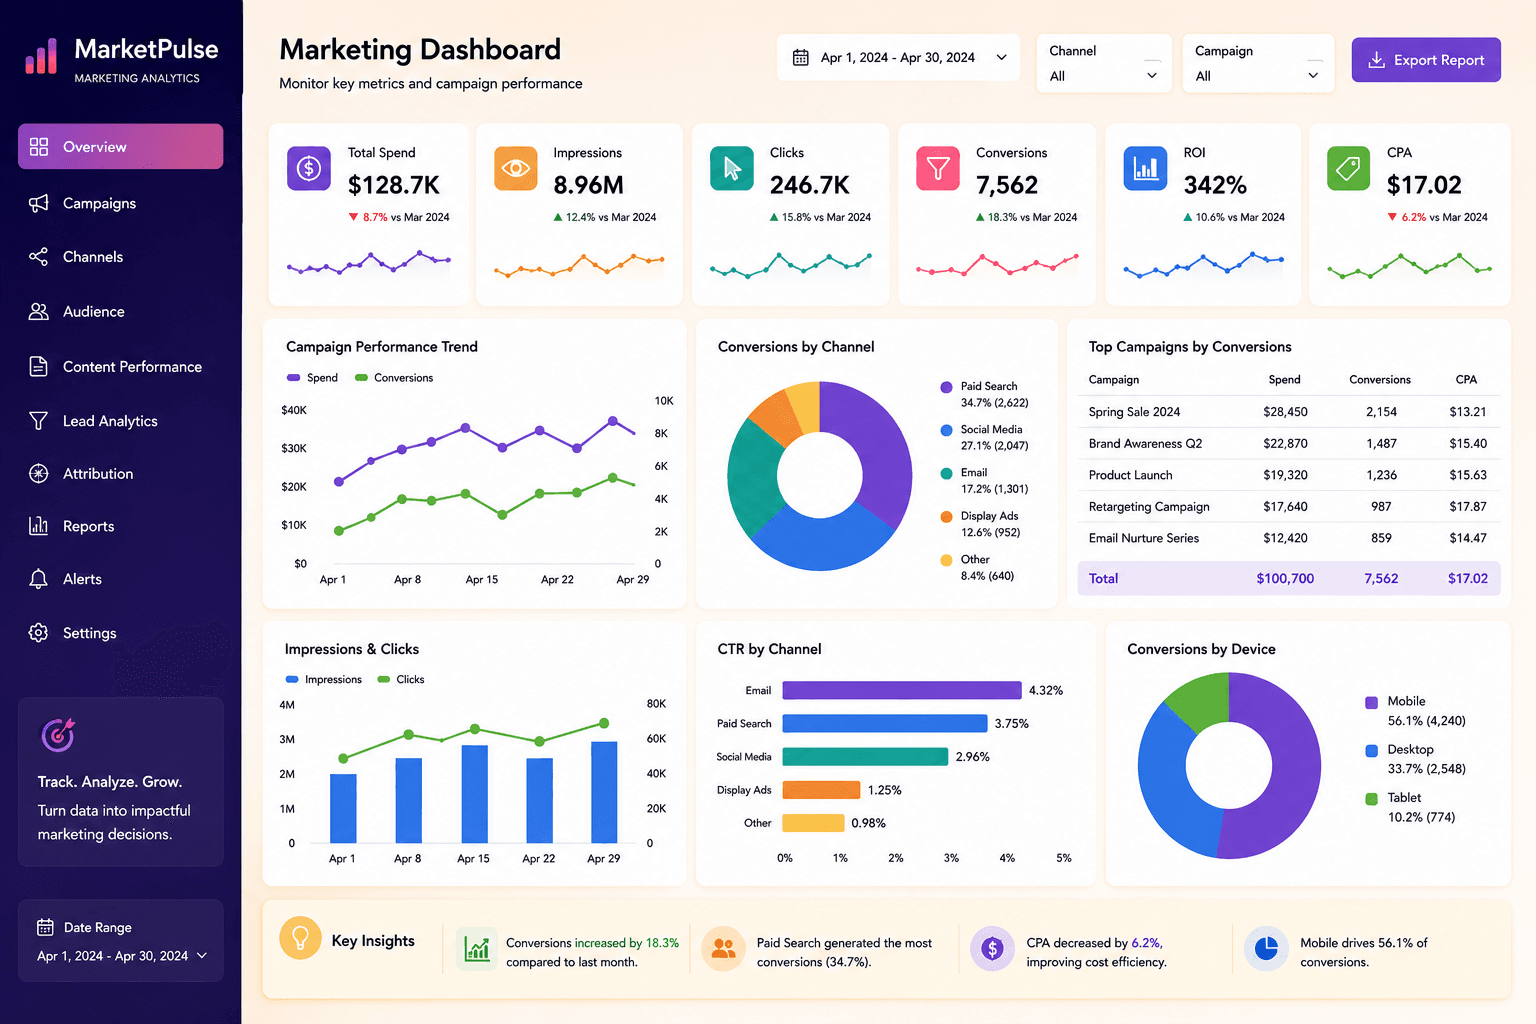
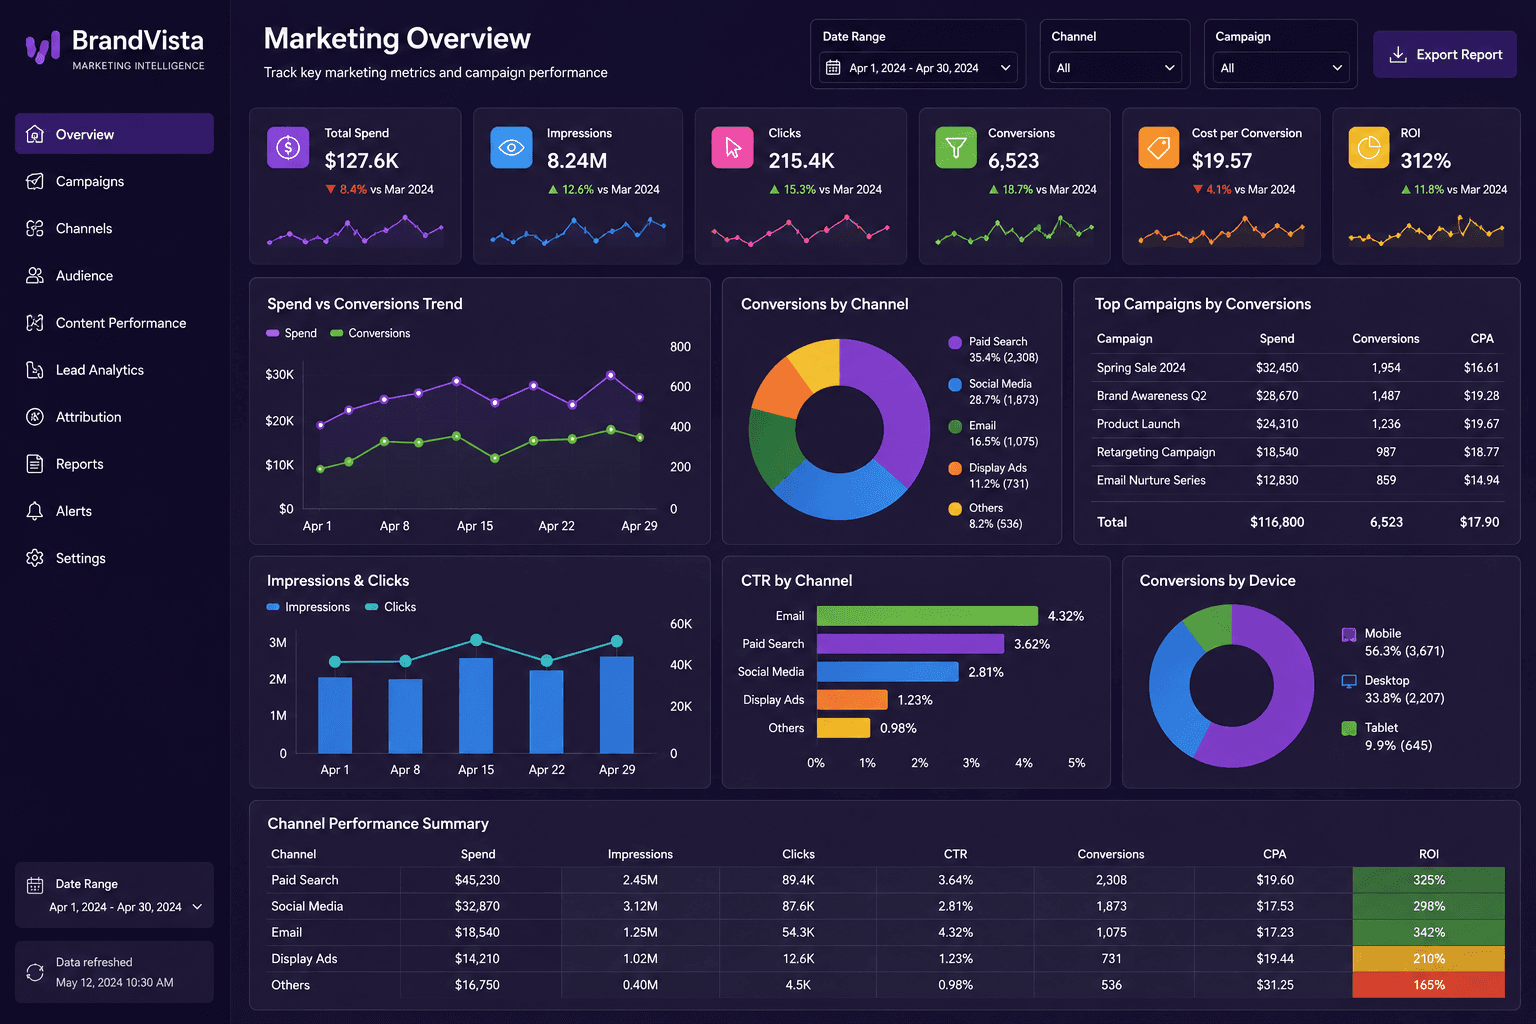
We built a Power BI marketing dashboard combining campaign metrics, lead performance, conversion rates, and ROI.
Key insights of this dashboard
This dashboard helps users move from a high-level performance view into more specific business insights. It is designed to make trends, gaps, and opportunities easier to identify without relying on manual spreadsheet reporting.
- Campaign performance tracking
- Lead generation analysis
- Conversion rate monitoring
- Marketing ROI reporting
- Channel performance comparison
Client feedback
The client said the dashboard helped them stop guessing which campaigns were working.
What you can expect
This dashboard is ideal for businesses running paid ads, email campaigns, social campaigns, or lead generation funnels.
Related services
How to use this dashboard
Start with the KPI cards, then use the visuals to compare trends, identify performance changes, and drill into the areas that need attention. In a live version, users can interact with slicers, charts, bookmarks, and report pages.
The interaction, download, and open report options are locked for now. Users can sign up and request the complete dashboard file when you are ready to provide access.