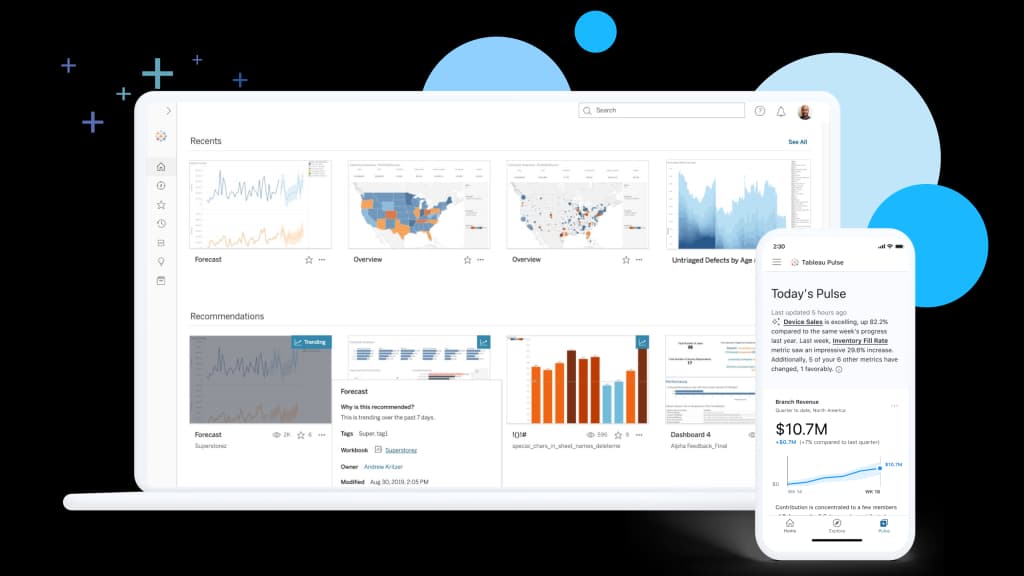
Executive Sales Overview
TableauA clean commercial dashboard for revenue, growth, and region performance.
Get your Tableau report delivered in few days with our 8 years of experience in data visualization.
Built for visual exploration, business storytelling, and confident data-driven decisions.
Inspired by reporting workflows used by teams at:
Why teams choose us
We combine reporting clarity, usability, and business intelligence design to create Power BI experiences teams actually use.
Design Power BI dashboards that match your workflows, KPIs, and reporting priorities.
Turn raw reporting into clear visual narratives that reveal trends and risks.
Create cleaner dashboards with intuitive navigation, filters, and interactions.
Help teams make quicker decisions with focused performance visibility.
Tableau workflow
Tableau dashboards work best when your data is clean, connected, and ready for analysis. We help structure your data sources so reporting becomes easier to manage and scale.
With Tableau, your team can:
Access data from files, databases, spreadsheets, and cloud platforms
Combine, shape, and clean reporting data for better analysis
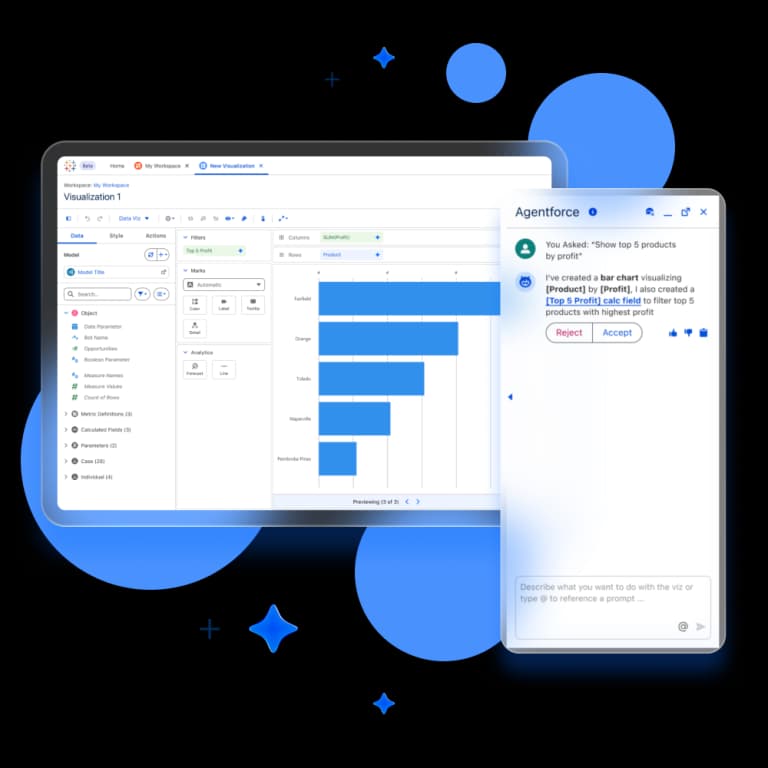
Tableau workflow
Move beyond static reporting with interactive dashboards that help teams explore patterns, compare performance, and understand what is changing across the business.
Tableau gives your team the power to:
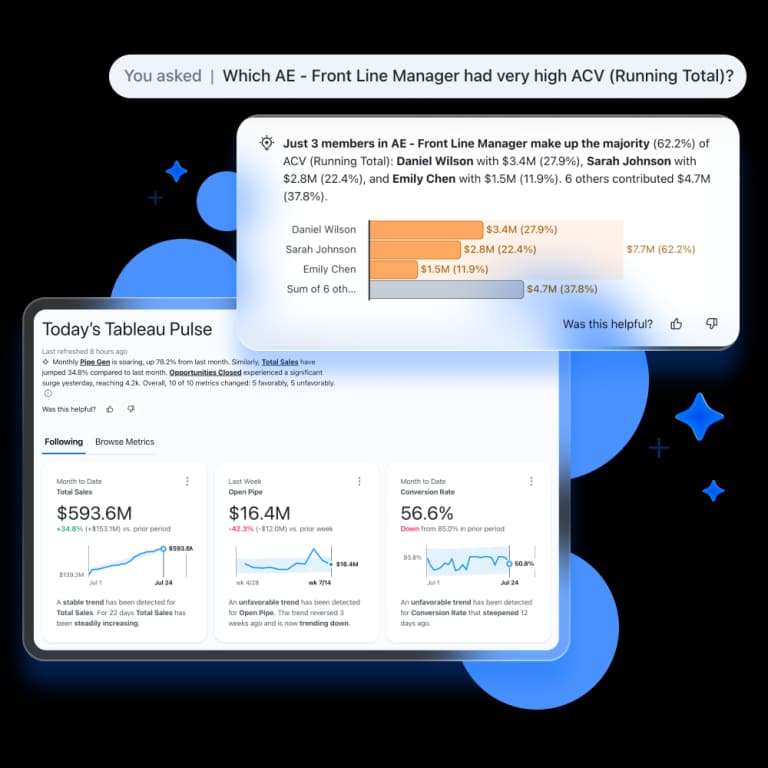
Monitor key performance indicators with clear visual dashboards
Explore deeper insights through guided analysis and interactive reporting
Dashboard Showcase
Built to make performance easier to see, easier to understand, and easier to act on. Each dashboard is designed to reduce noise, highlight what matters, and support better decision-making.
A clean commercial dashboard for revenue, growth, and region performance.
How we work
Effective Tableau reporting requires more than attractive charts. It needs structure, visual clarity, and dashboards designed around how teams explore and interpret information.
We focus on analytical clarity, usability, and storytelling so the final Tableau dashboards feel intuitive, insightful, and useful in real business workflows.
We identify the reporting goals, the audience using the dashboards, and where the current analytics process lacks clarity, flexibility, or visual insight.
We define the reporting logic, dashboard hierarchy, visual flow, filters, and analytical structure before design and development begin.
We create interactive Tableau dashboards designed for exploration, storytelling, usability, and clearer business visibility.
We test performance, refine interactions, optimize dashboard responsiveness, and prepare the Tableau reporting system for adoption.
Tableau Reviews
Tableau Reviews


980+
16%Growth in visual analytics requests this year
Average Rating
4.9
Based on Tableau dashboard and analytics delivery
The Tableau dashboard made complex survey results much easier to explore. The visual flow helped our team explain findings clearly.
Sarah M.
Research Coordinator
2025-03-18
The final Tableau report was clean, interactive, and easy to present. It turned scattered data into a strong visual story.
Kevin R.
Business Analyst
2025-06-02
We needed dashboards that could support decision-making without overwhelming users. Byond Data delivered exactly that.
Grace P.
Program Officer
2025-09-14
The Tableau visuals helped us understand customer and sales patterns much faster than our old reports.
James O.
SME Founder
2025-11-27
The dashboard design was professional and practical. It helped us move from static reports to interactive analysis.

Esther C.
Monitoring Specialist
2026-02-09
Ready to improve visual analytics?
From executive dashboards to advanced visual analytics, we help teams turn business data into interactive reporting experiences.
Tableau FAQ
Clear answers about Tableau reporting, integrations, dashboards, visual analytics, and project delivery.