Summary
This executive dashboard was built to give leadership a simple but powerful view of sales performance.
Project objectives
- Give executives a fast performance overview.
- Improve sales KPI visibility.
- Support management reporting.
Business challenge
The client needed a dashboard that executives could understand quickly without going through long spreadsheets.
How the dashboard was built
The project involved cleaning sales data, preparing a reporting model, creating DAX measures, and designing a leadership-focused layout.
Solution delivered
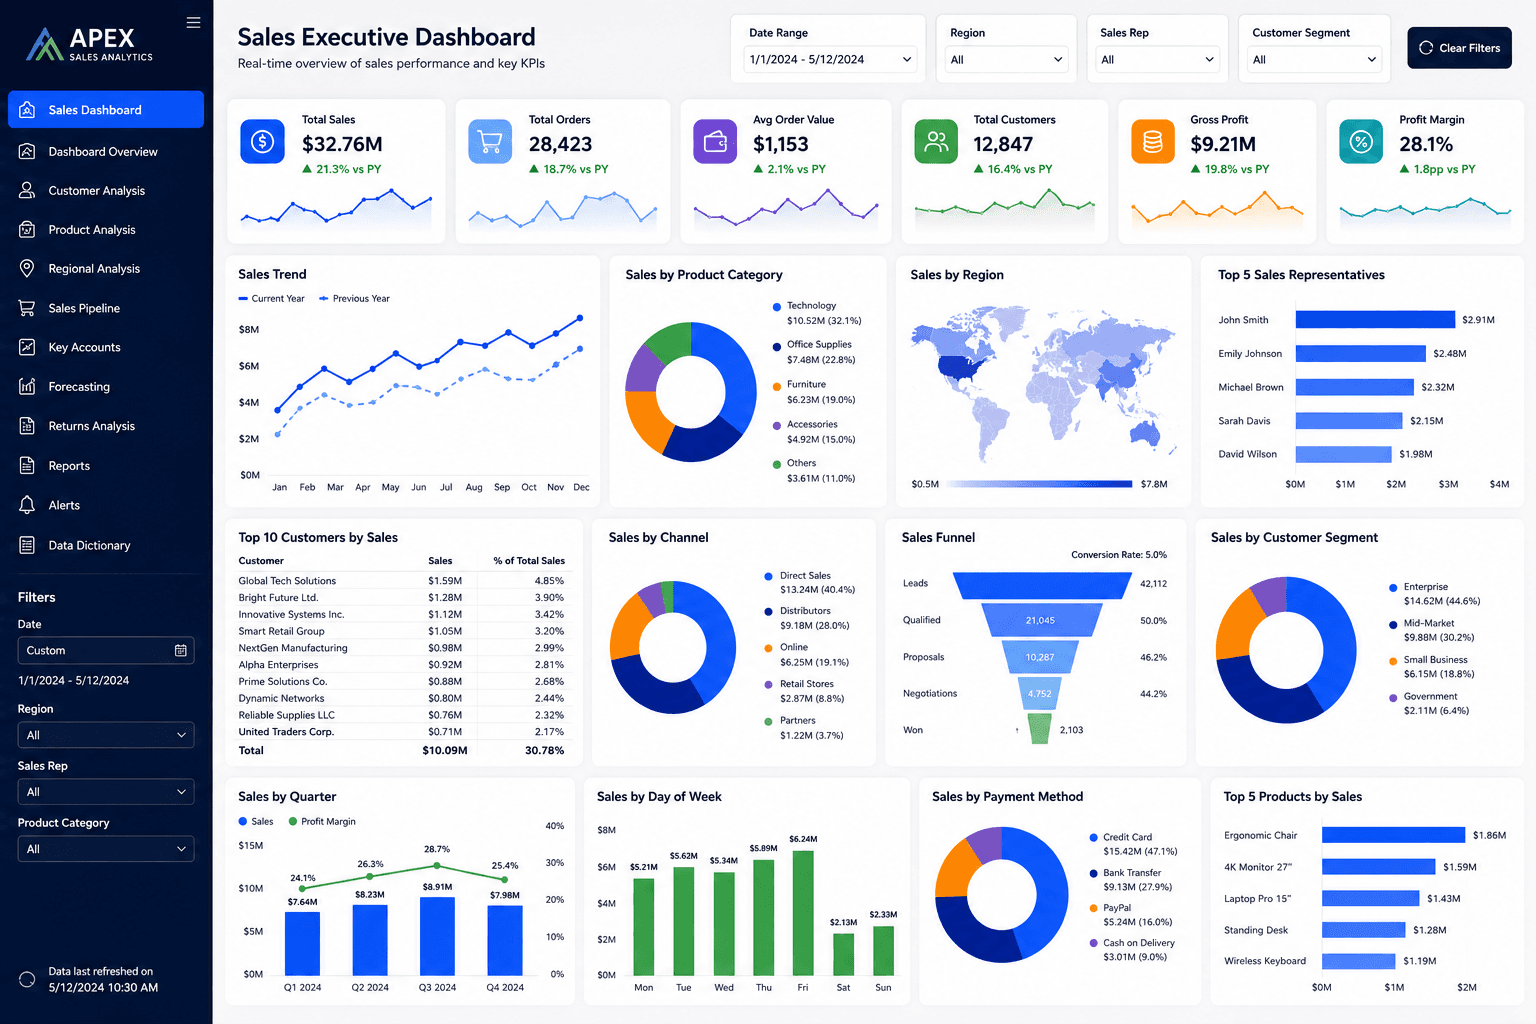
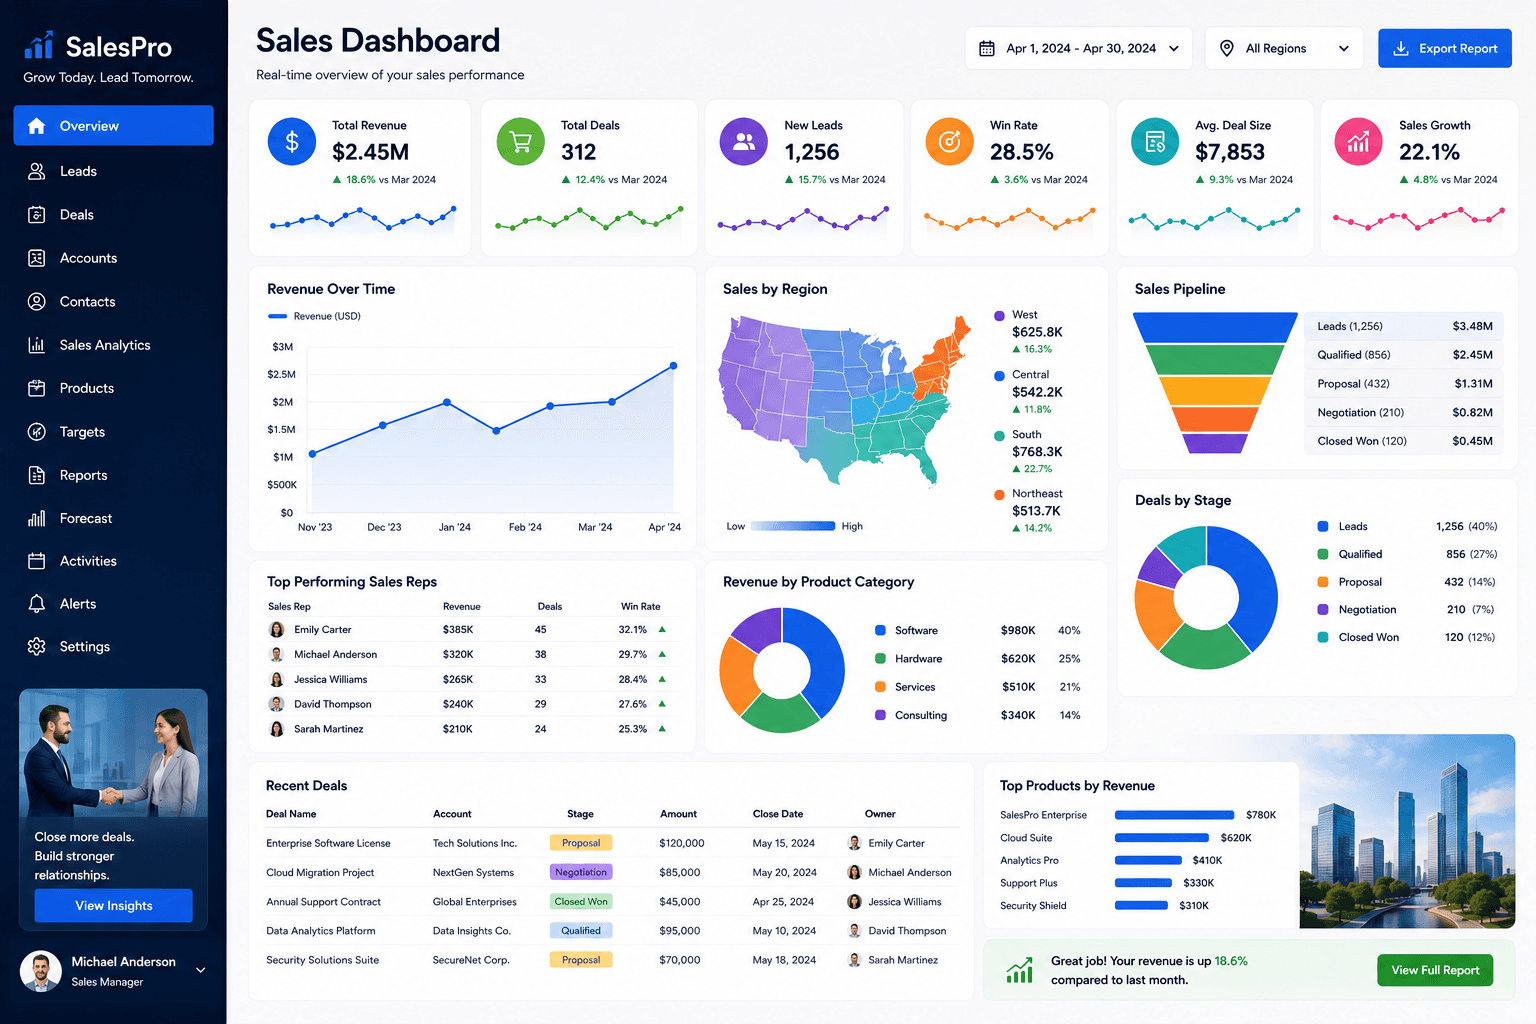
We created a Power BI KPI dashboard with revenue cards, trend visuals, ranking tables, and interactive filters.
Key insights of this dashboard
This dashboard helps users move from a high-level performance view into more specific business insights. It is designed to make trends, gaps, and opportunities easier to identify without relying on manual spreadsheet reporting.
- Executive revenue overview
- Sales growth analysis
- Target versus actual tracking
- Product performance summary
- Leadership KPI reporting
Client feedback
The client loved the clean layout and said it improved their monthly sales review meetings.
What you can expect
This dashboard is ideal for managers, directors, and business owners who need quick sales visibility.
Related services
How to use this dashboard
Start with the KPI cards, then use the visuals to compare trends, identify performance changes, and drill into the areas that need attention. In a live version, users can interact with slicers, charts, bookmarks, and report pages.
The interaction, download, and open report options are locked for now. Users can sign up and request the complete dashboard file when you are ready to provide access.